Introduction: Quantum Mechanics, Schrödinger, Hydrogen atom. Spectra
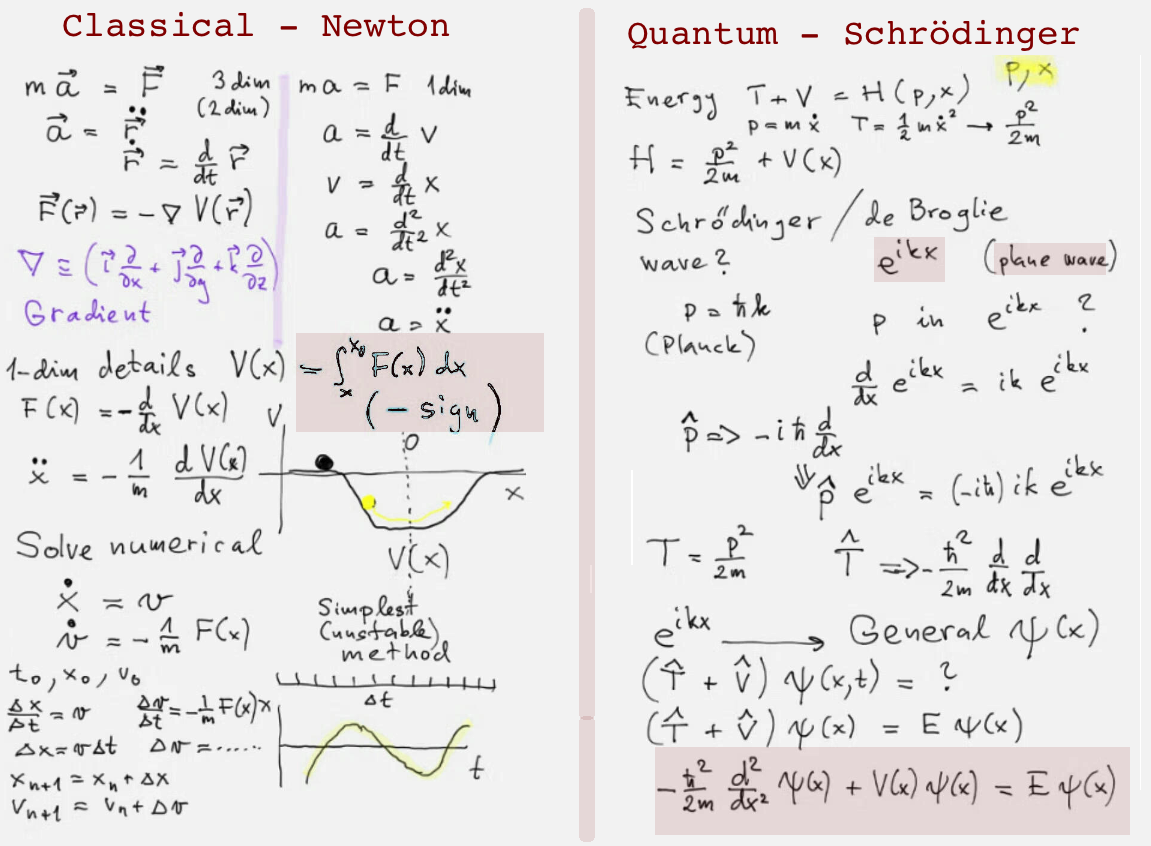
This plate is from a discussion - based on some earlier lectures. It turns our attention to general problems,
in contrast to those which can be solved analyticaly.
When general problems are solved - numerically - the differences between the two fields appear in the sketched perspective.
Classical physics - system of ordinary ( and in fact 1. order ) differential equqtions
Quantum physics - allways over the whole space. And as mentioned in the next plate - complex numbers are essential
Also sketched is a qualitative way to Schrödinger equation: from de Broglie's assumptions to Schrödinger's construction.
No energy concept in Newton's time - see e.g. https://en.wikipedia.org/wiki/Conservation_of_energy
https://en.wikipedia.org/wiki/Vis_viva It is energy in Quantum Mechanics ( or the Hamiltonian )
0005_Classical-Quantum.png
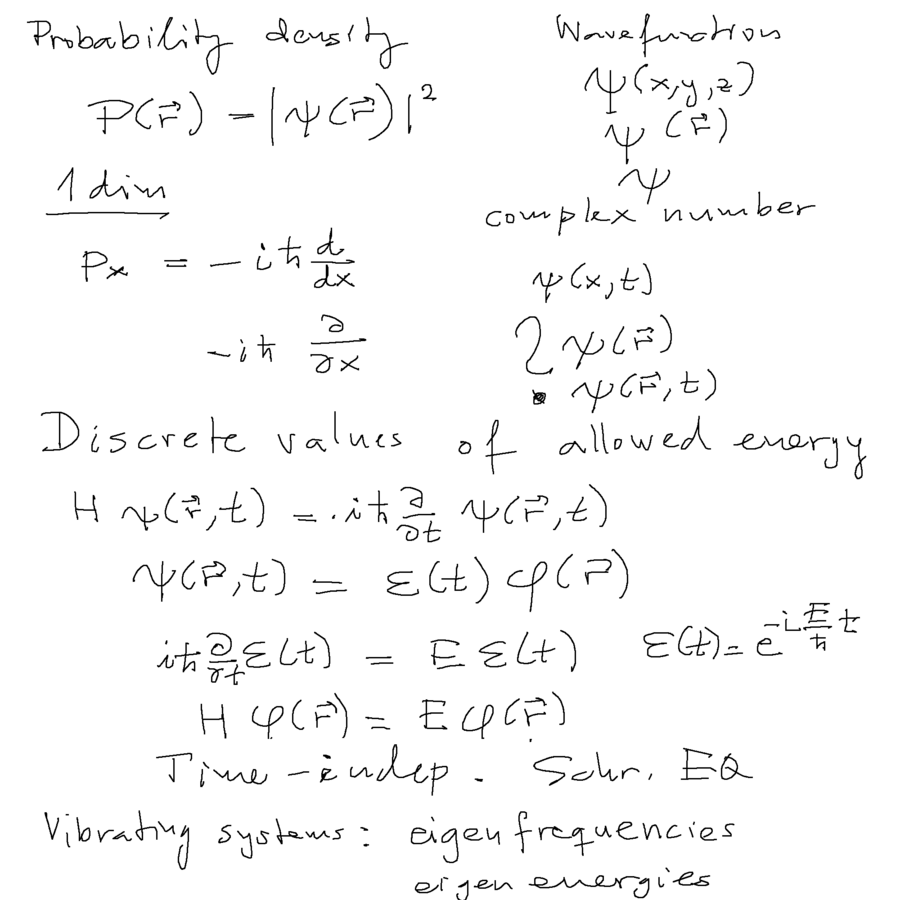
Born's idea about probability density <-- from wavefunction is the cornerstone of quantum physics.
Time dependent Schrödinger equation vs. Stationary problems ( time and space variable separation )
0010_Probability_Schrodinger.png
Historically - allowed energies - explained the spectra.
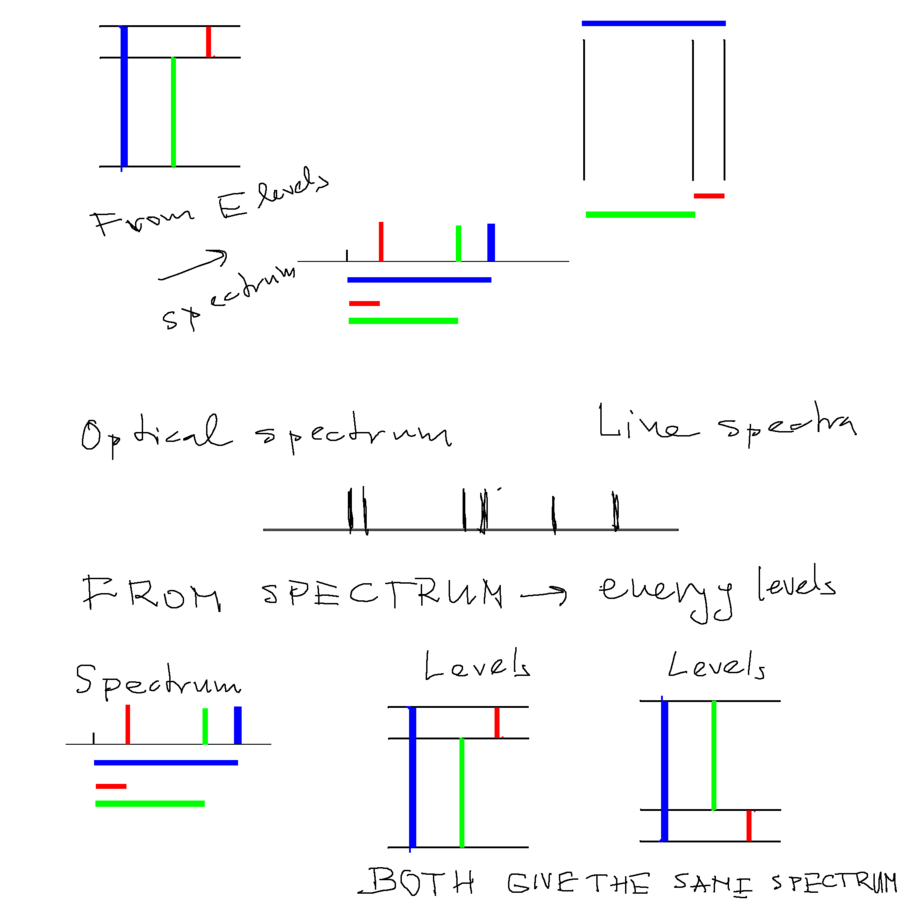
Here is a little exercise showing the relation between ENERGY LEVEL DIAGRAM and ENERGY SPECTRUM
Historically it was wavelength spectrum - but Planck's work had shown the relation between energy and frequency (ant thus wavelength )
What we have demonstrated below: if you know the spectrum - you still do not know the energy levels
in the lowest part of this plate is demonstrated that the same spectrum is consistent with both of the LEVEL DIAGRAMS
0020_Levels_and_spectrum.png
-------------
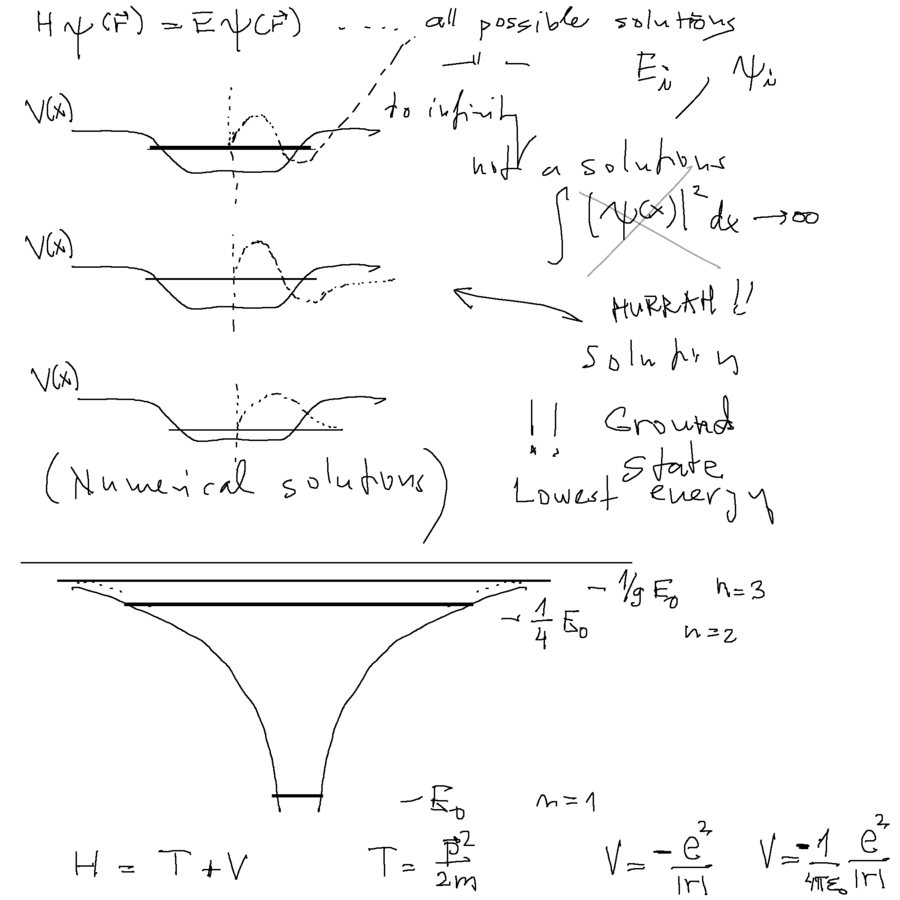
So why are there only certain allowed energies?
In one dimensional cases - for wrong energies the solution will "blow up" at infinity (also in 2-dim and 3-dim, but more complicated)
Only for some energies the solutions vanish outside of the attractive region ( Hurrah when we hit .... )
0030_Eigenenergies.png
( more about Gauss and SI later .... )
The good and bad solutions - in Schrödinger Toy Program (browser application) http://folk.uib.no/nfylk/PHYSTOYS/schroed/
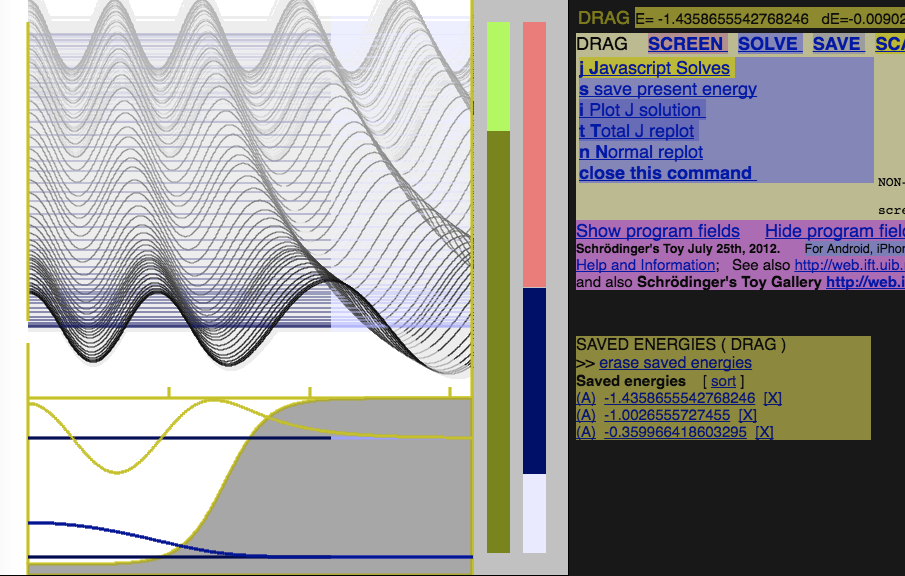
0035_Schrodingers_Toy.png
Getting to the good energy and good solution: - in Schrödinger Toy Program (browser application) http://folk.uib.no/nfylk/PHYSTOYS/schroed/

Playing_with_Schrodinger_Toy.png
DECREASING or INCREASING ?????
Below: Kinetic energy operator - from momentum operator - gradient - Laplace operator - SPHERICAL COORDINATES
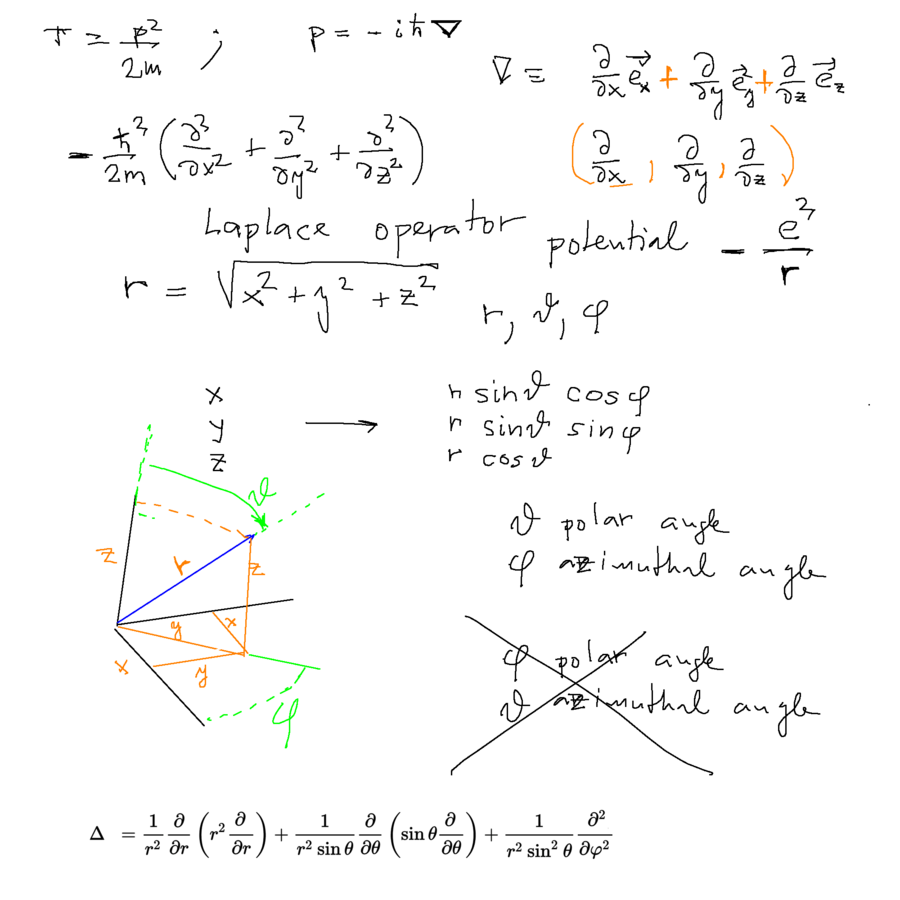
0040_Radial_Coordinates.png
LAPLACE OPERATOR - Spherical coordinates Separation of Variables
https://en.wikipedia.org/wiki/Laplace_operator#Three_dimensions
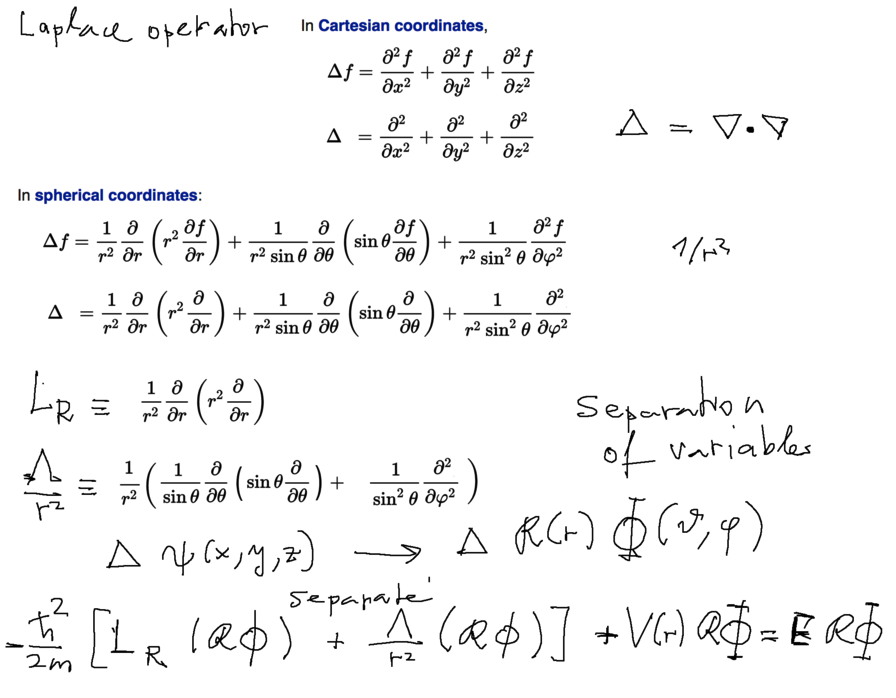
0050_laplace_operator.png
Additional snapshot: What also can be done with Schrödinger's Toy - Simple resonances
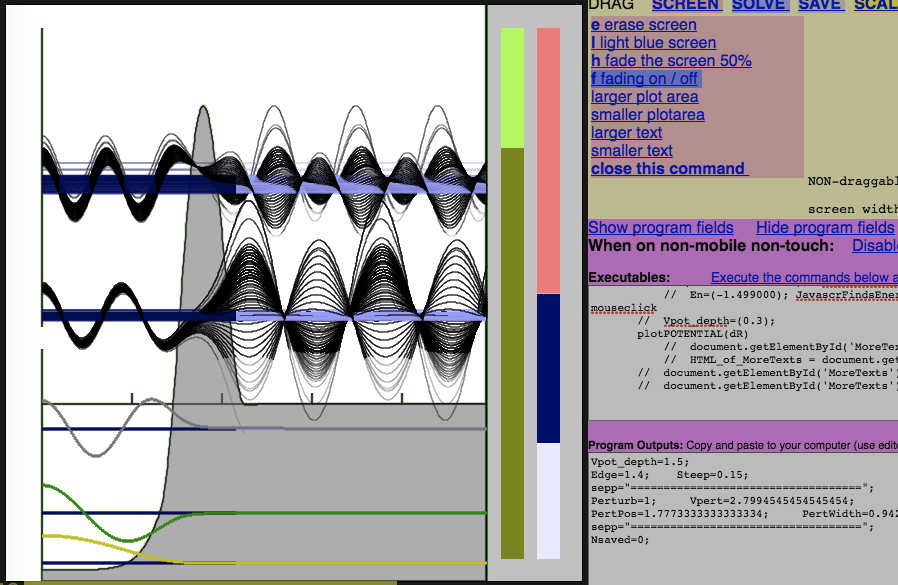
Playing_MORE_Schrodinger_Toy
Next time: Continue the work with
LAPLACE OPERATOR - Spherical coordinates Separation of Variables
More on hydrogen and experiments (and some historical facts)
Visualization of the "orbitals"
visit the last years' pages (open in new windows or tabs)
http://folk.uib.no/nfylk/PHYS261/2015_08_20/ (See the levels database there, cf below)
http://folk.uib.no/nfylk/PHYS261/2015_08_26/
http://folk.uib.no/nfylk/PHYS261/2014_08_19/
http://folk.uib.no/nfylk/PHYS261/2014_08_21/
http://folk.uib.no/nfylk/PHYS261/2014_08_26/ ( especialy the "Atomic Units part)
We also mentioned this (see the details in the first link above)
Level and lines diagrams from http://physics.nist.gov/PhysRefData/ASD/lines_form.html
This diagram requires Java in the browser, at present de-popularized due to possible security problems
when used on untrusted sites ( we can trust NIST - http://www.nist.gov)
The atomic database: http://www.nist.gov/pml/data/asd.cfm