
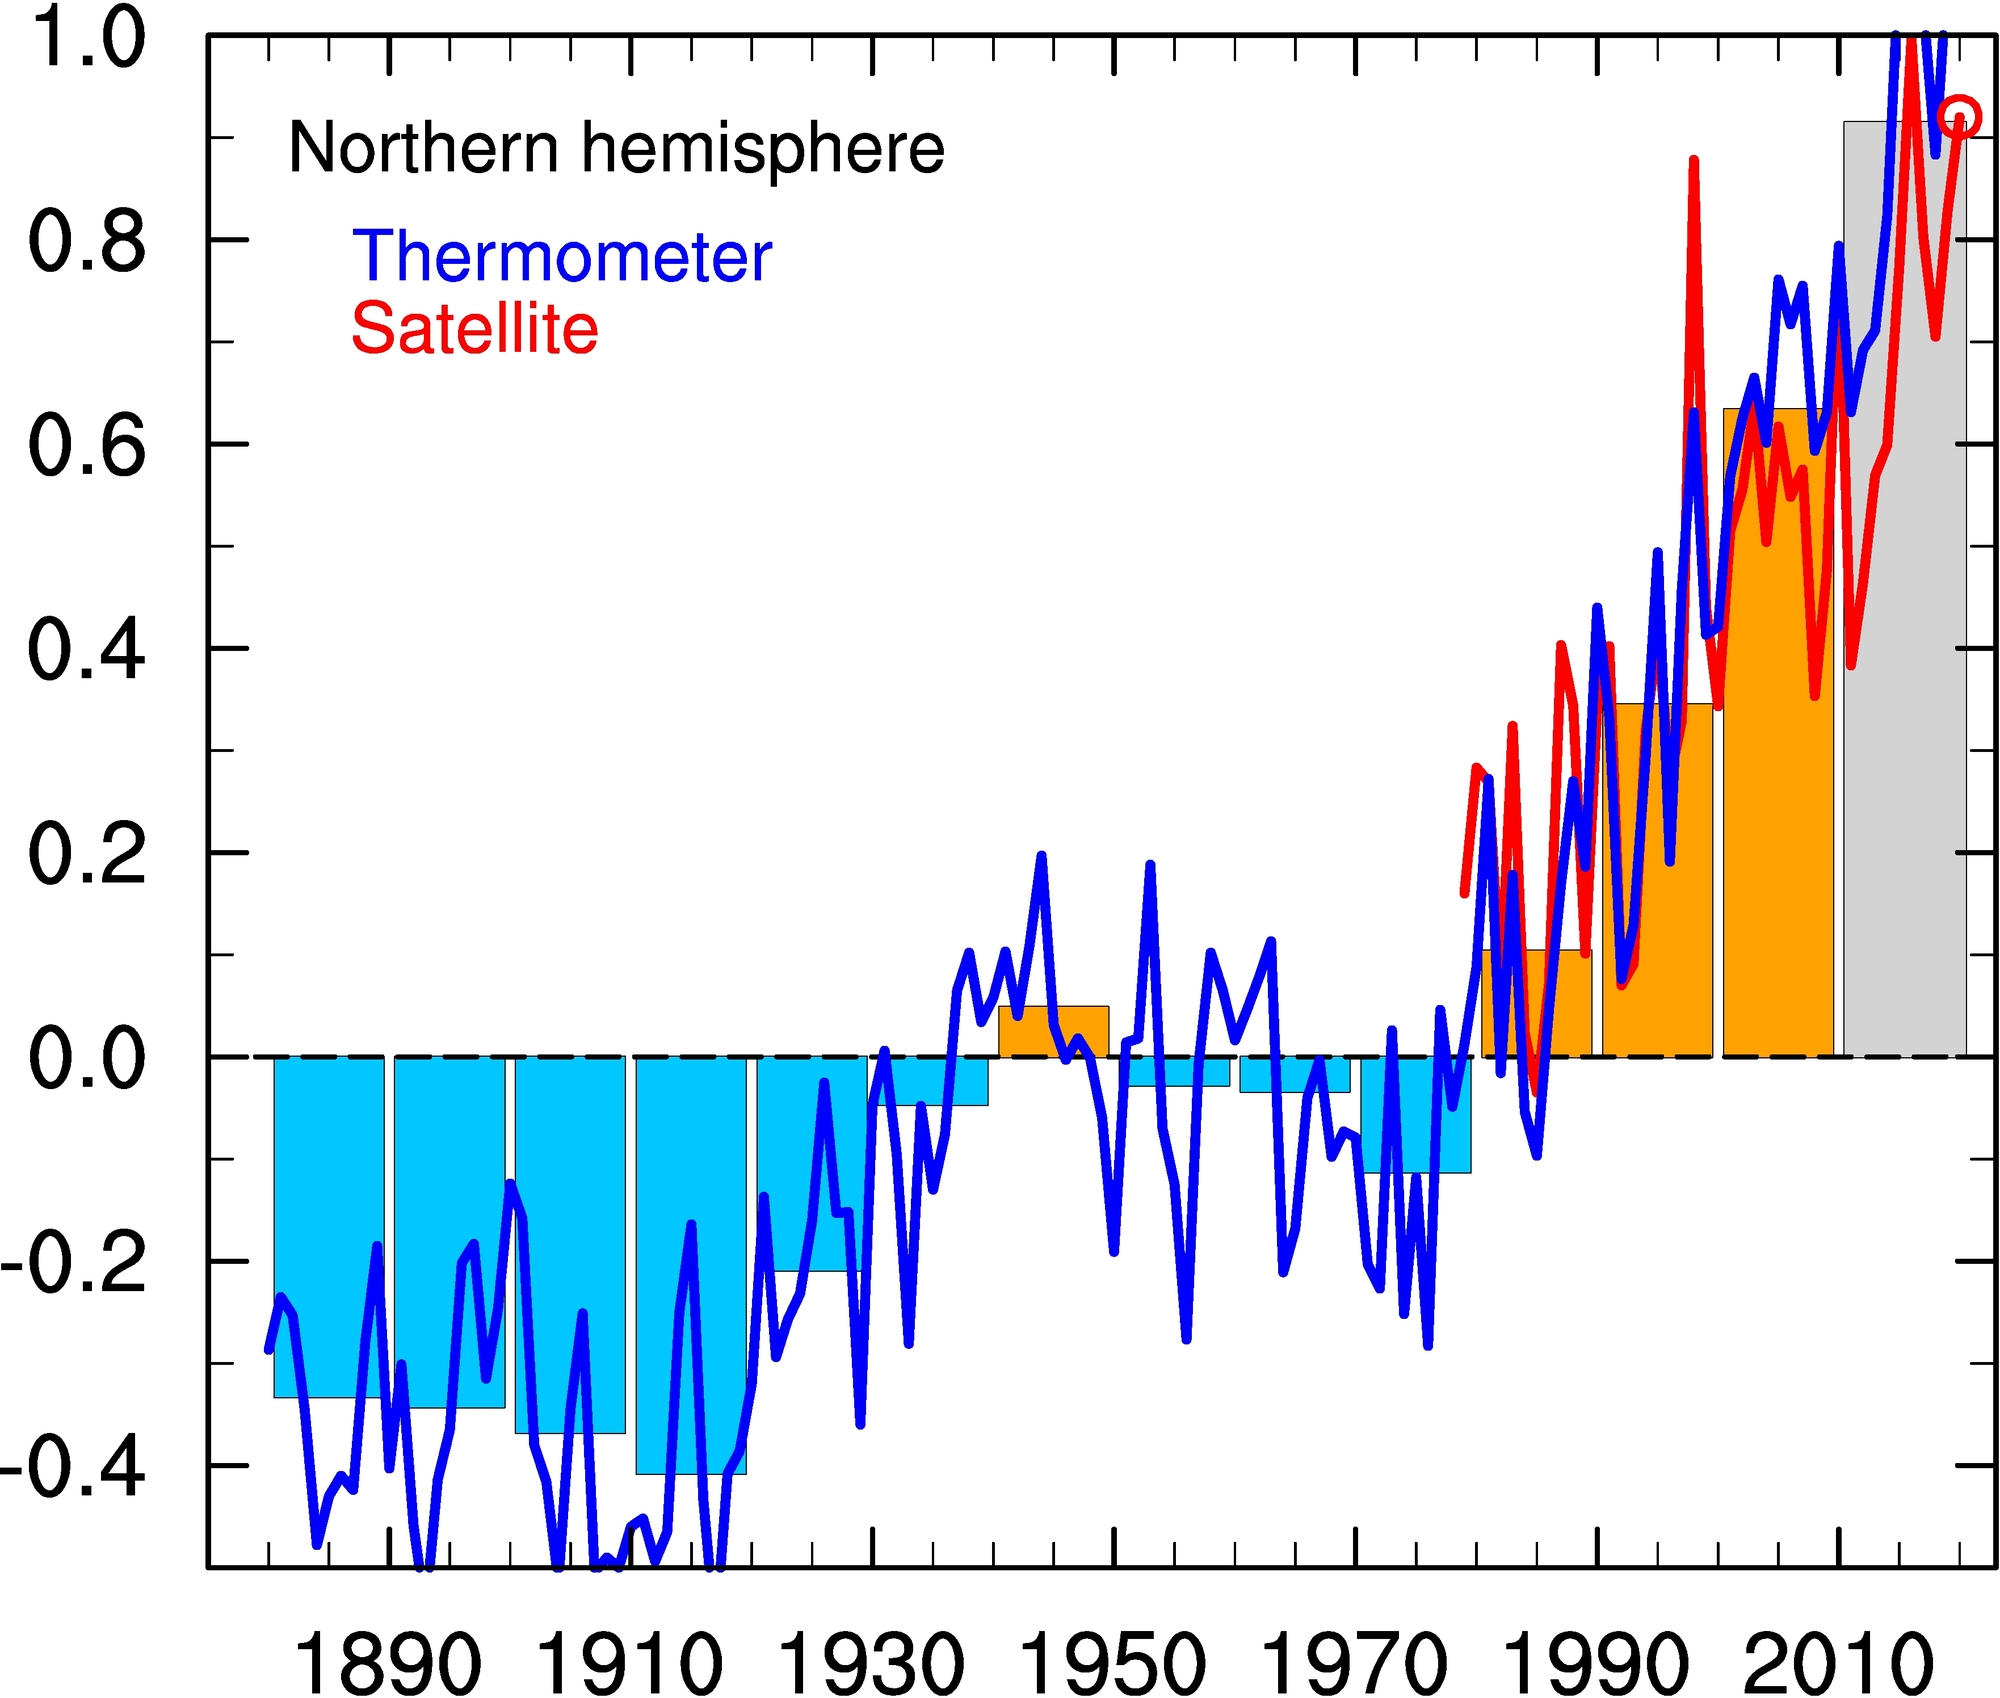
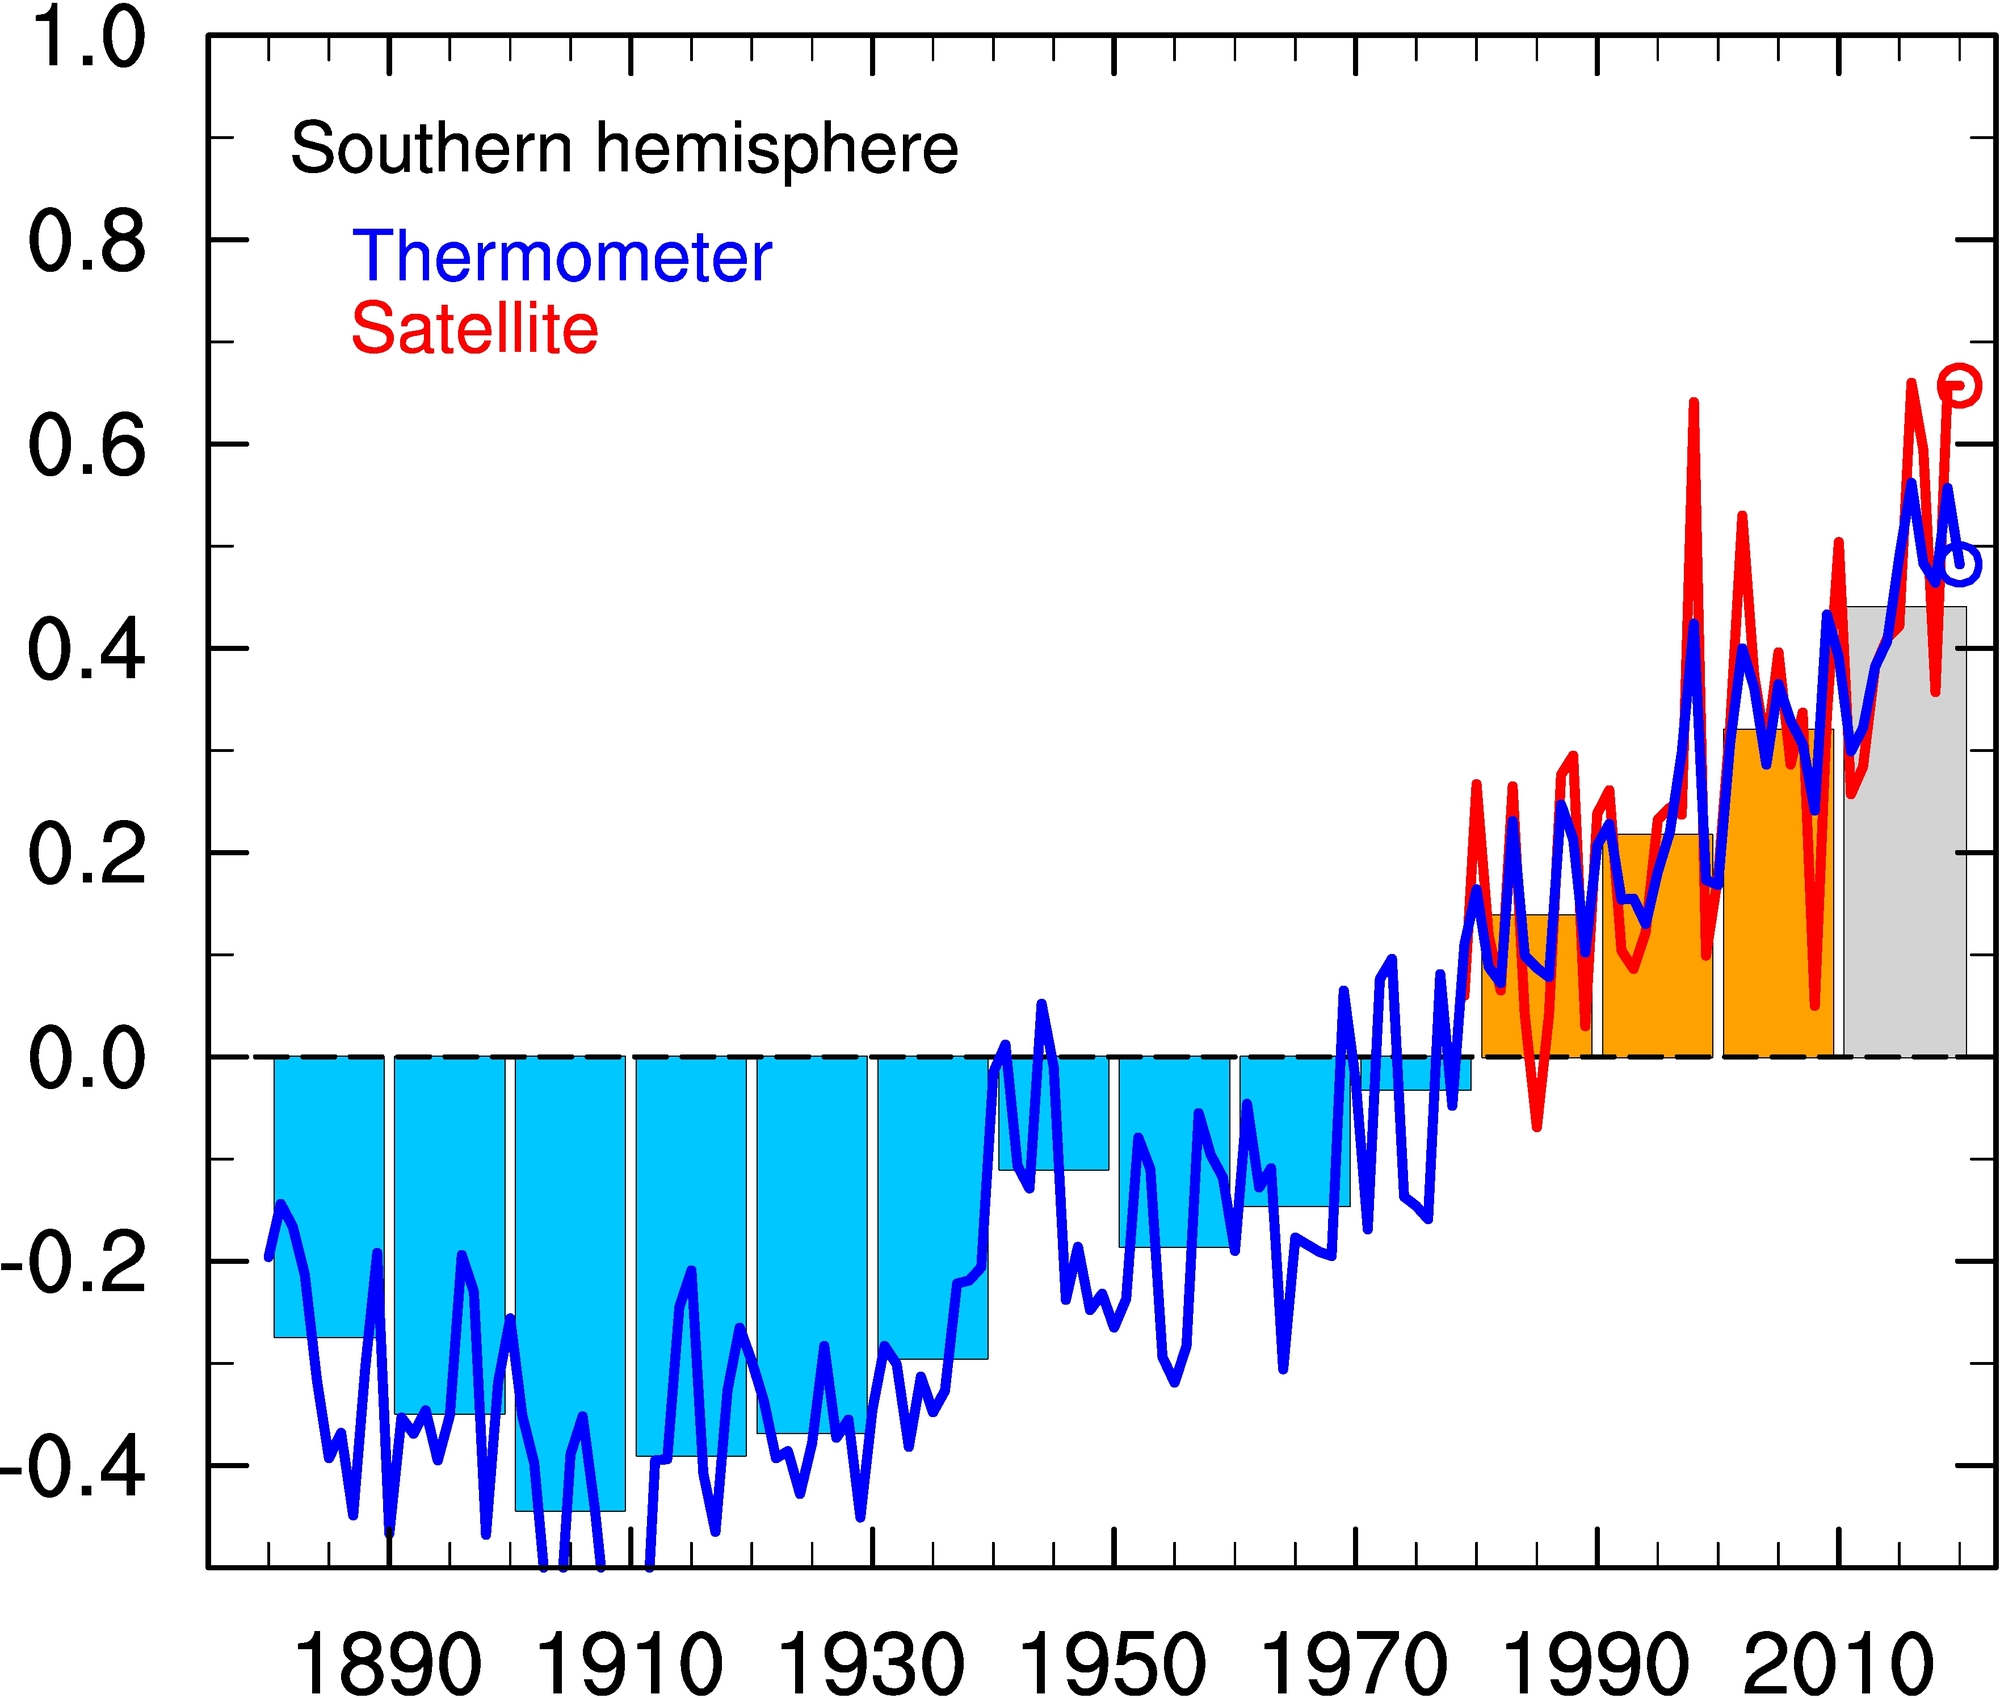
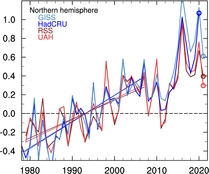
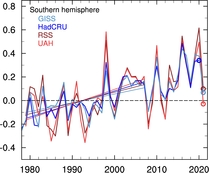
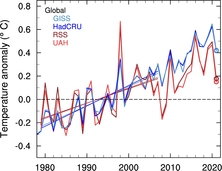
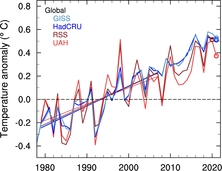
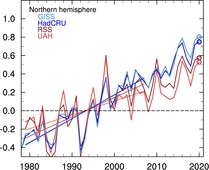
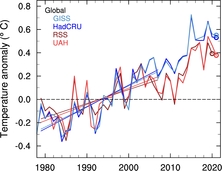
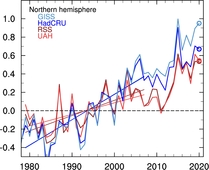
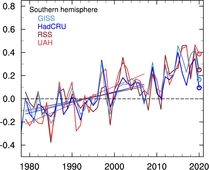
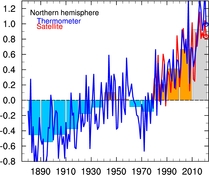
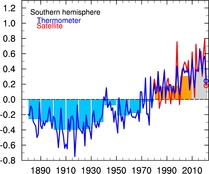
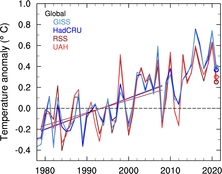
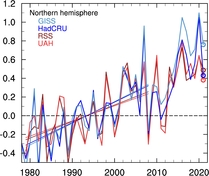
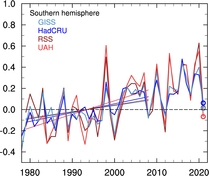
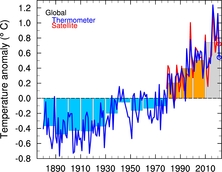
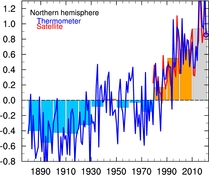
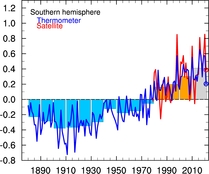
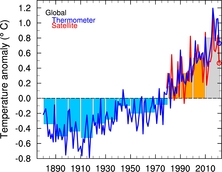
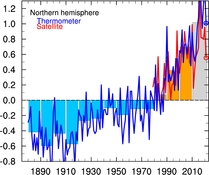
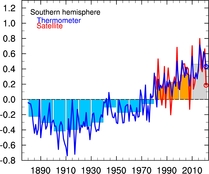
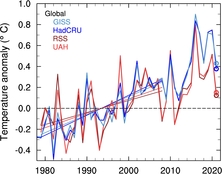
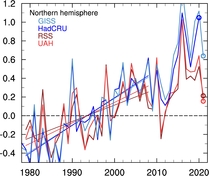
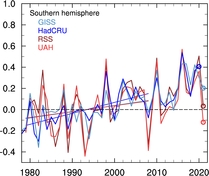
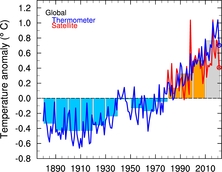
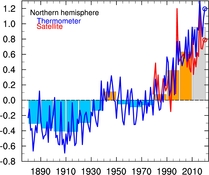
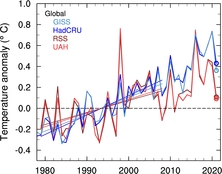
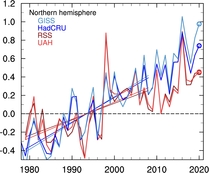
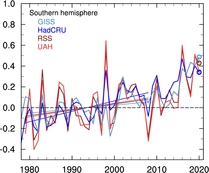
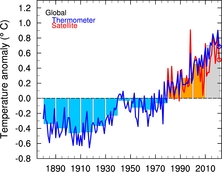
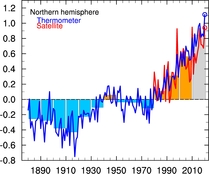
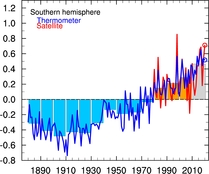
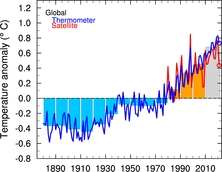
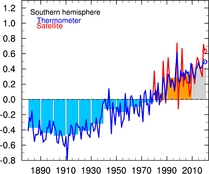
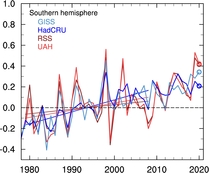
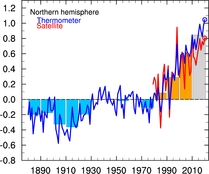
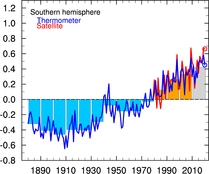
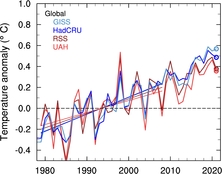
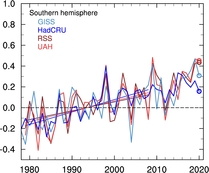
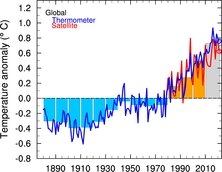
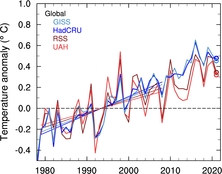
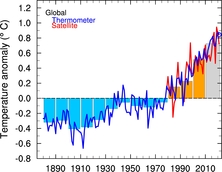
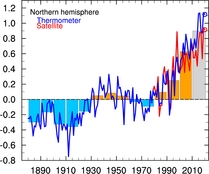
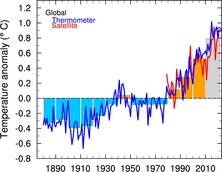
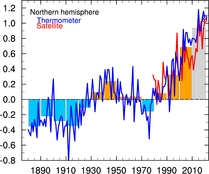
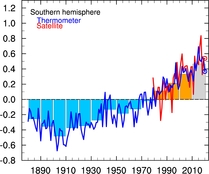
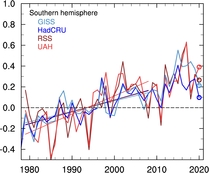
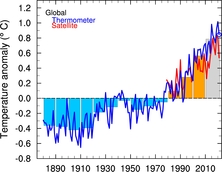
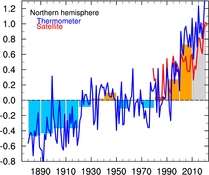
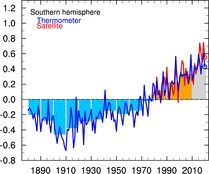
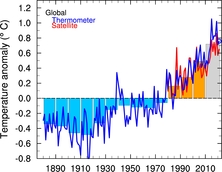
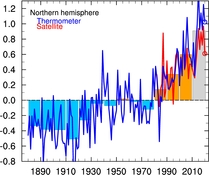
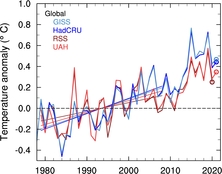
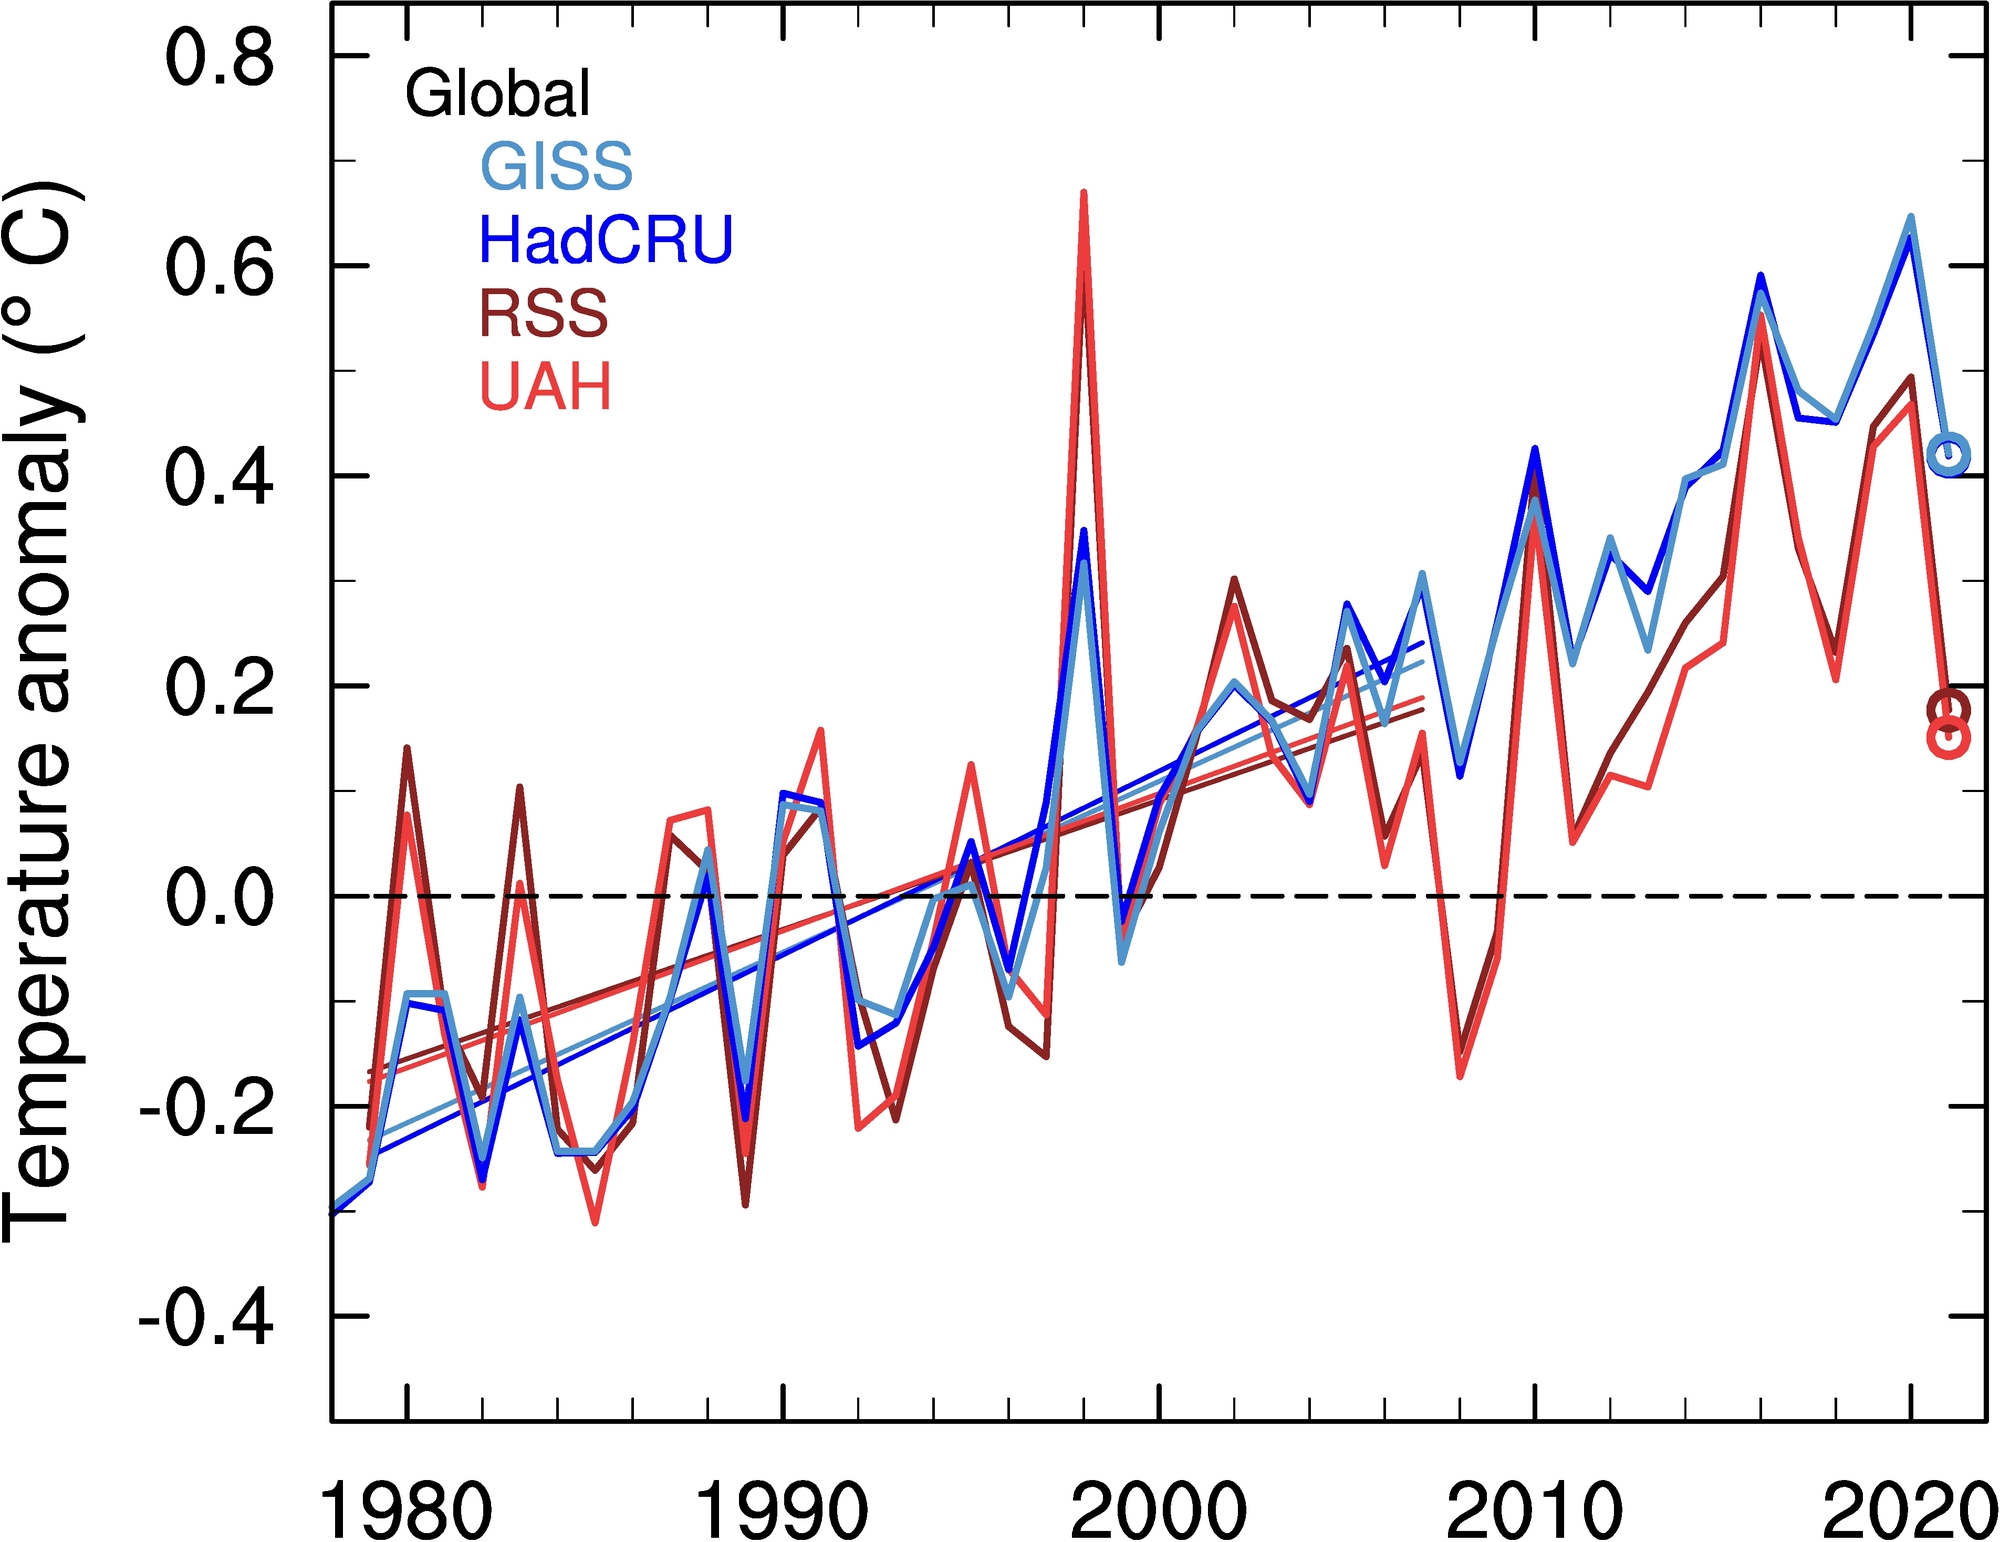
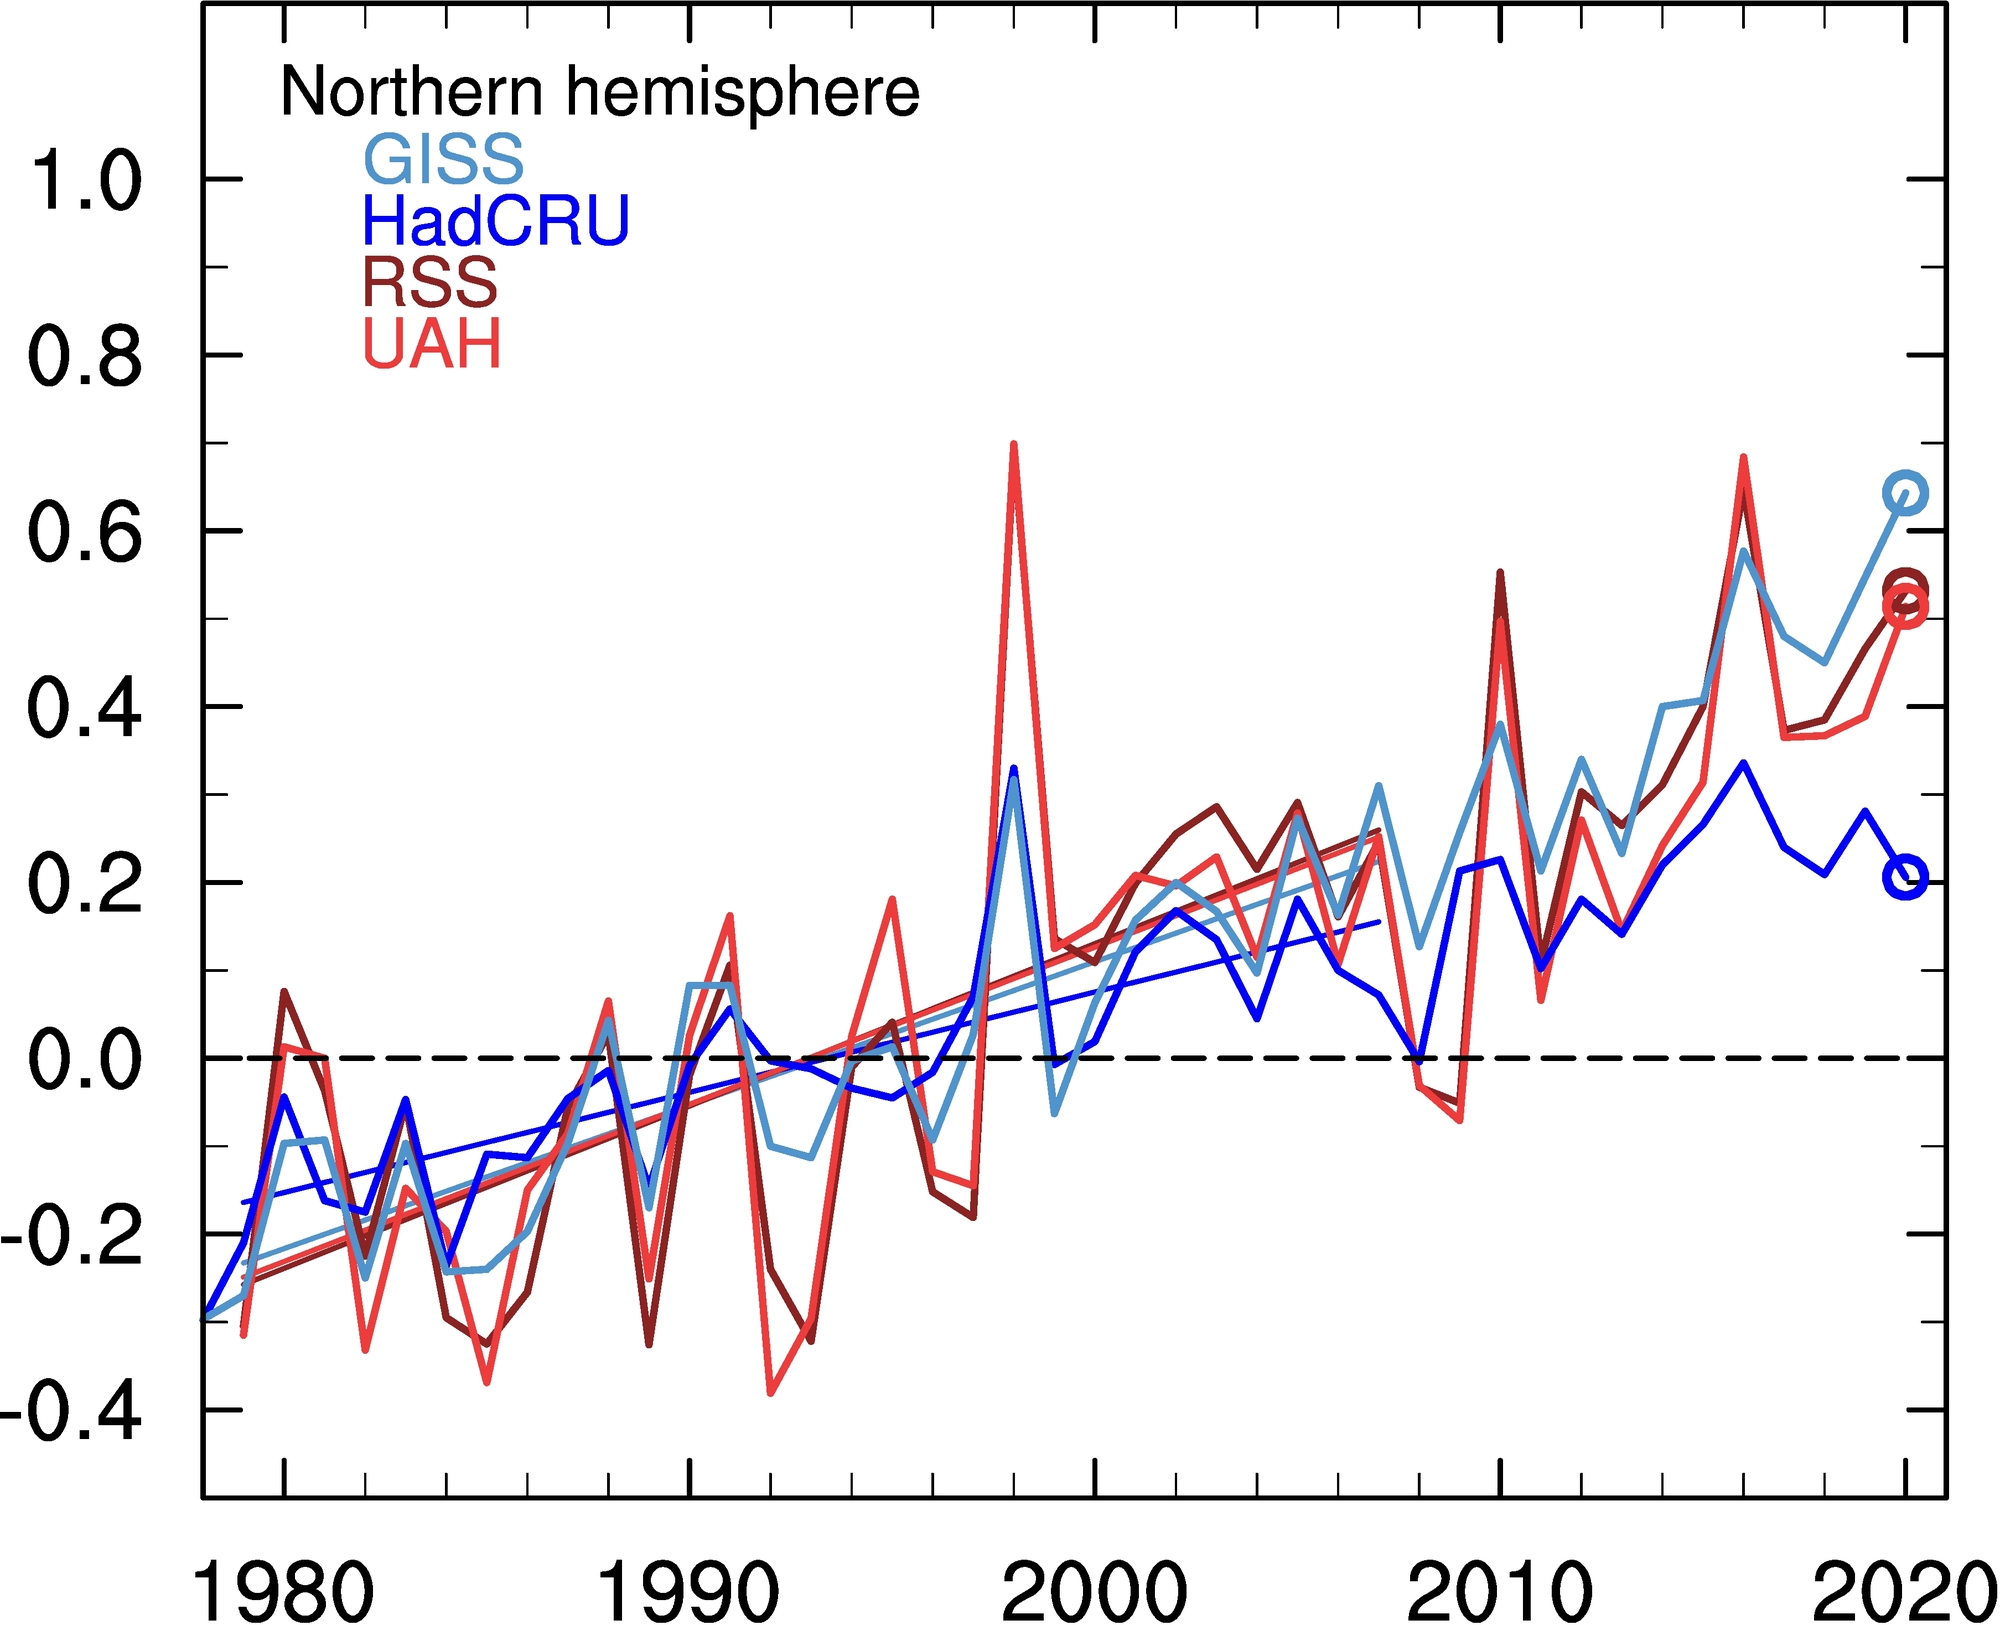
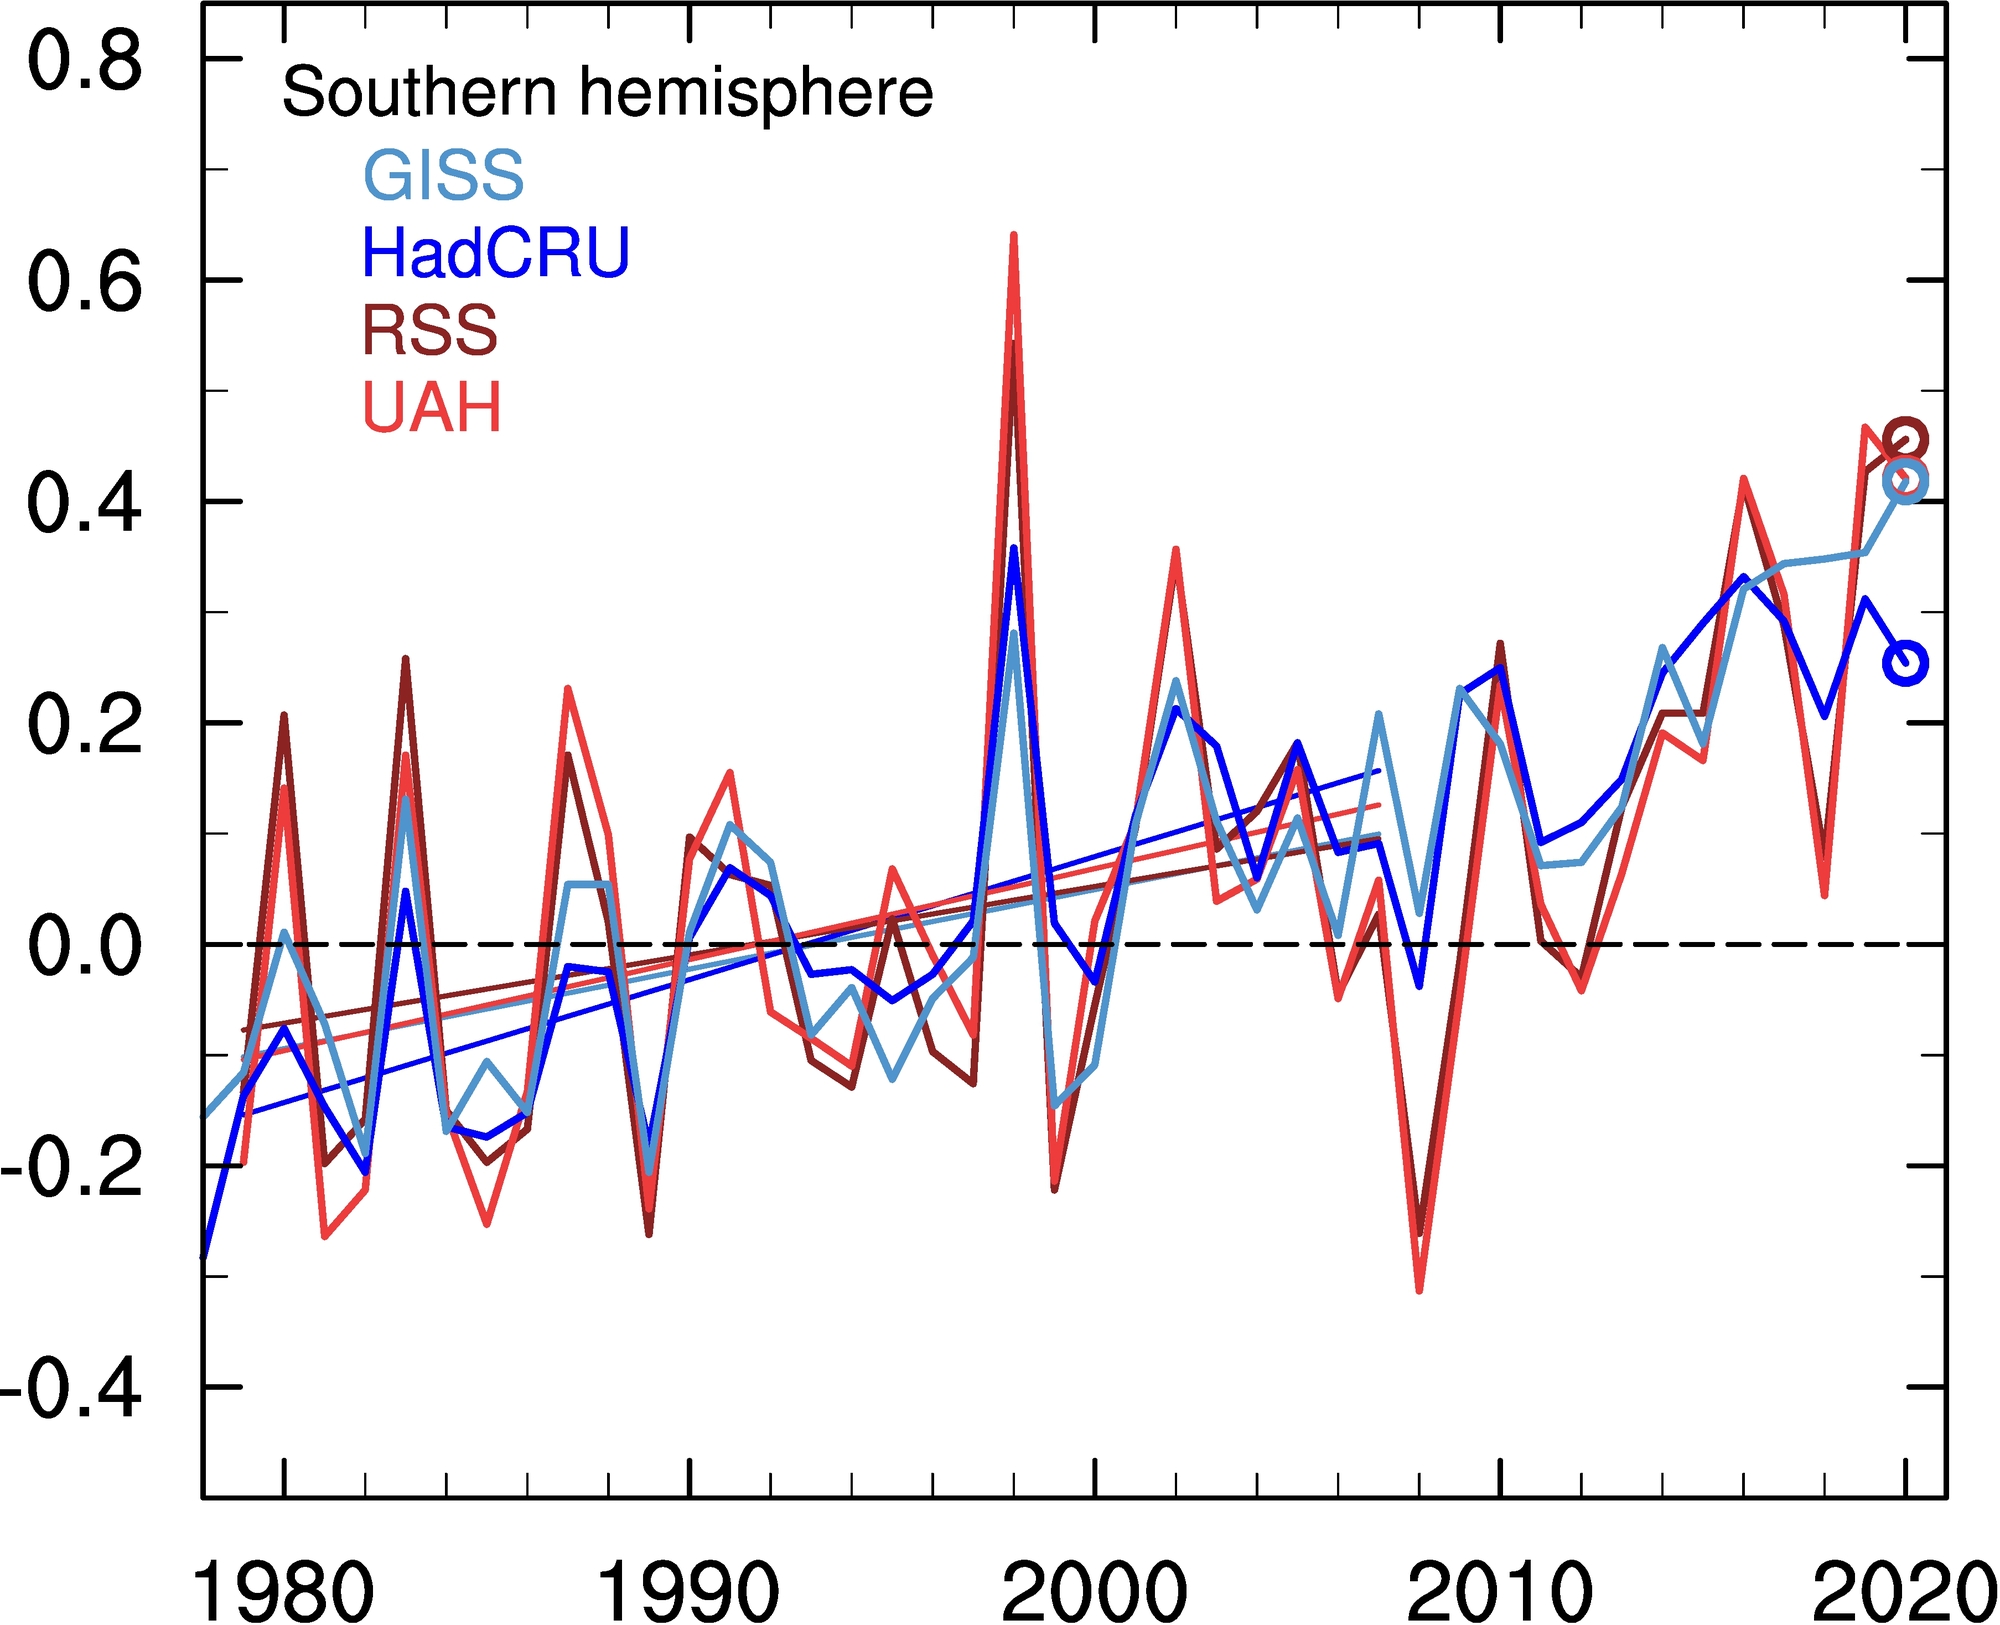
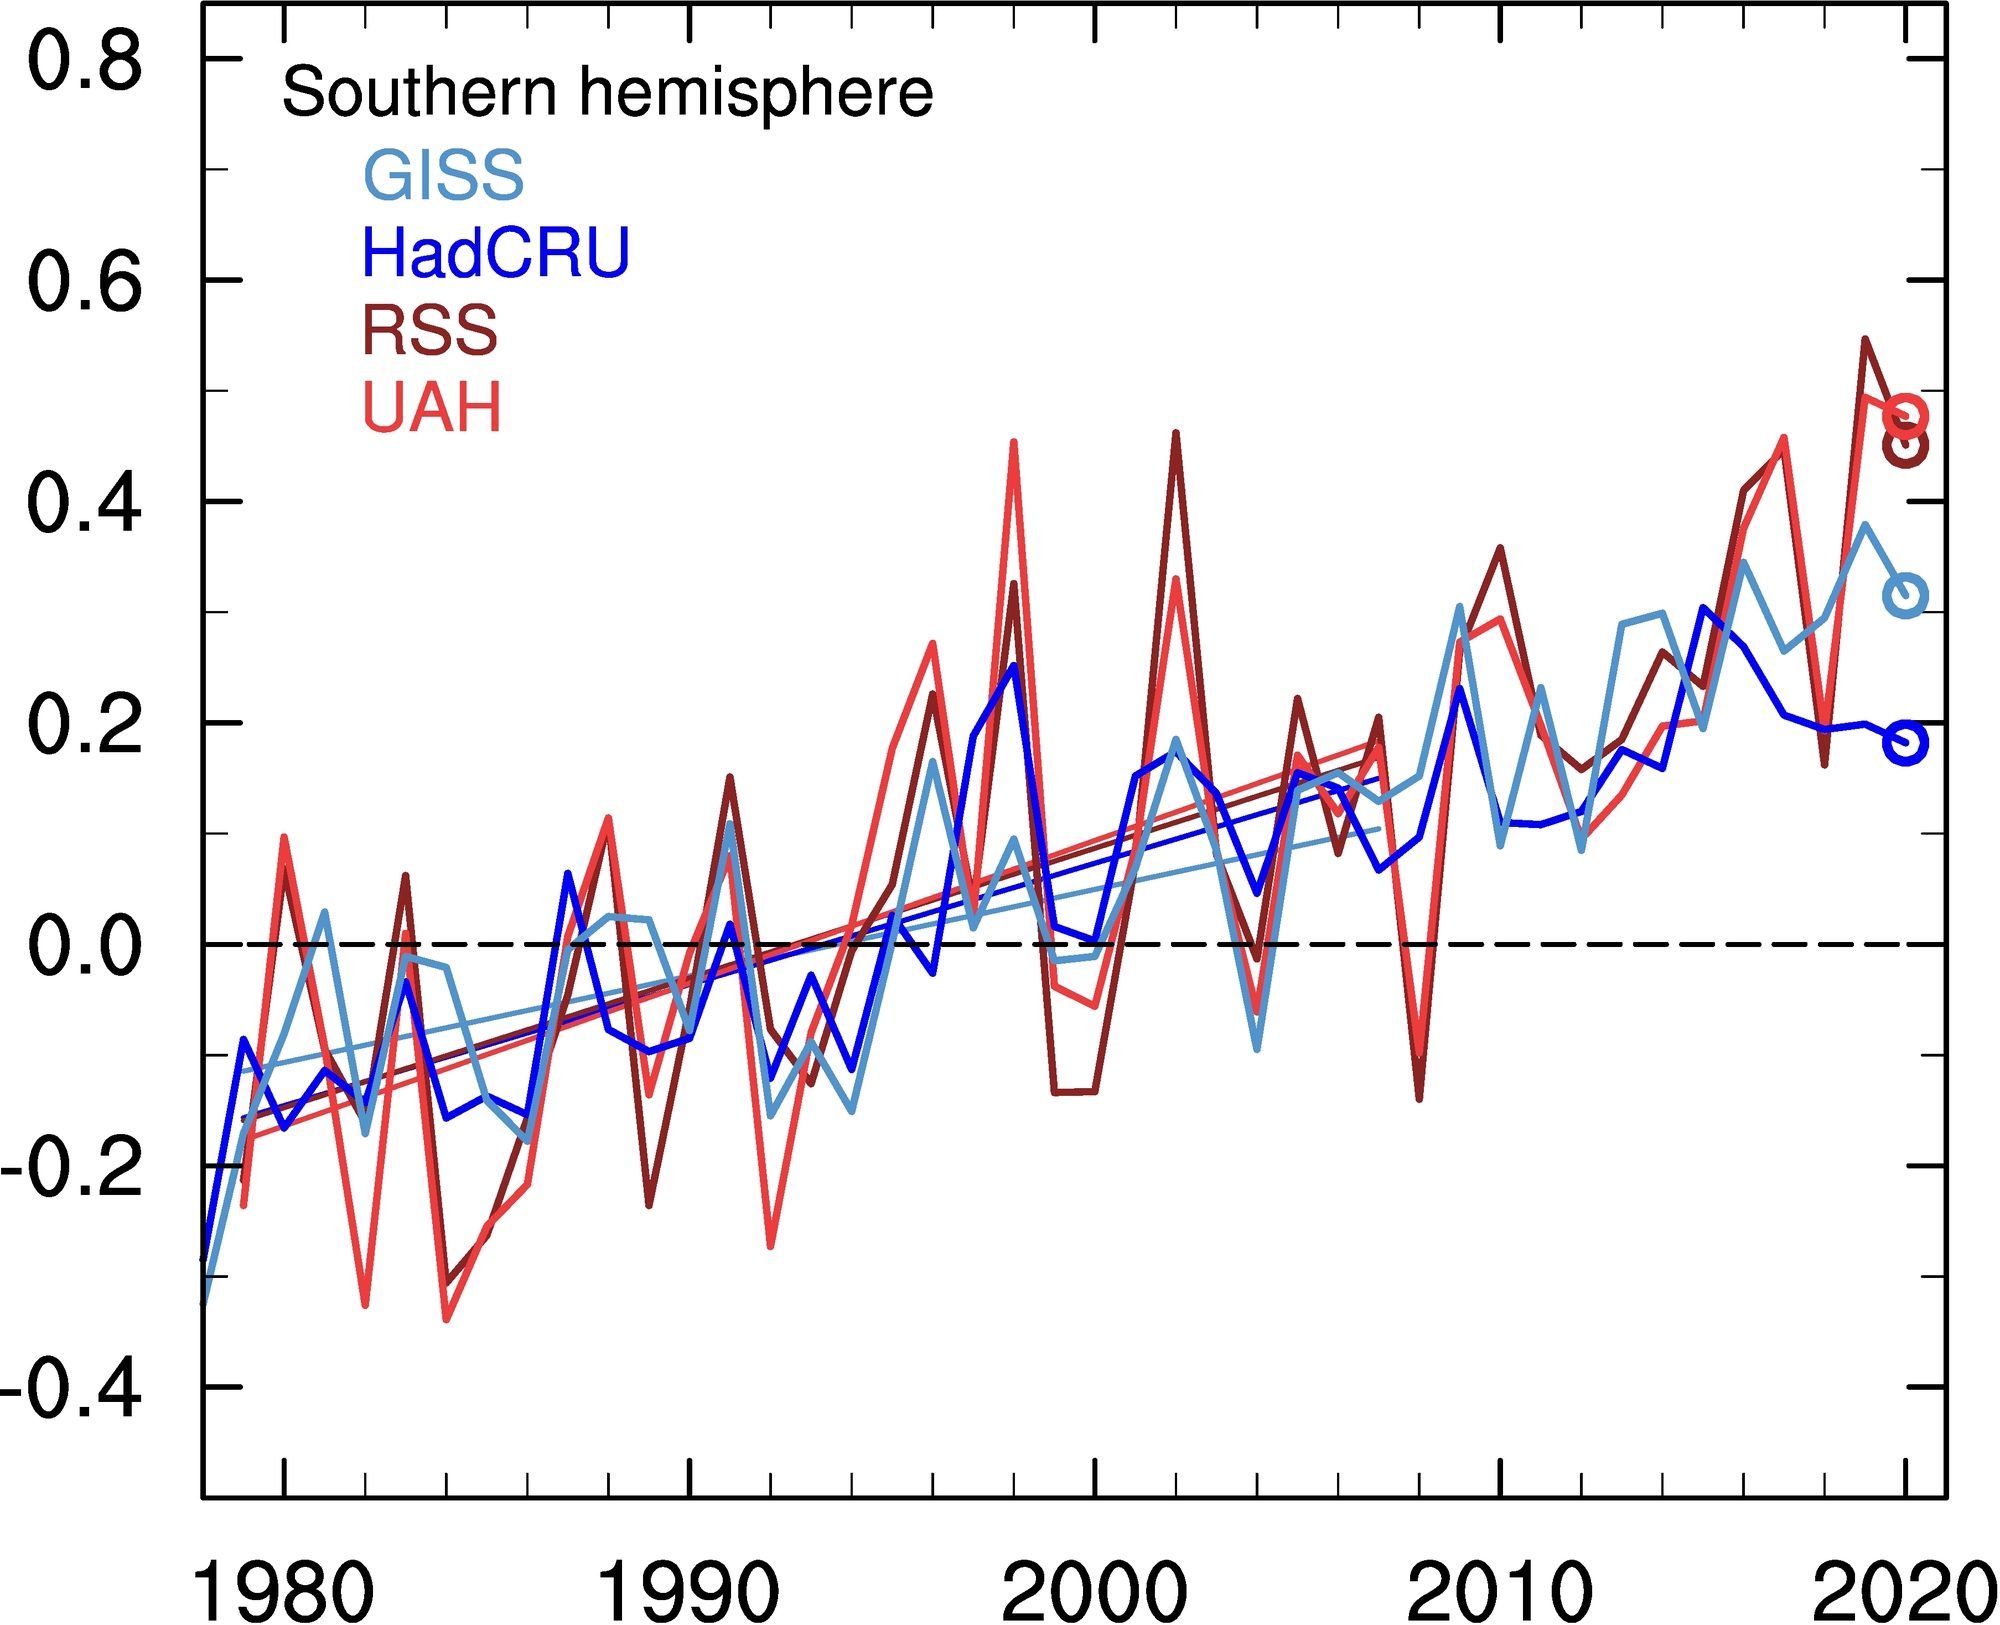
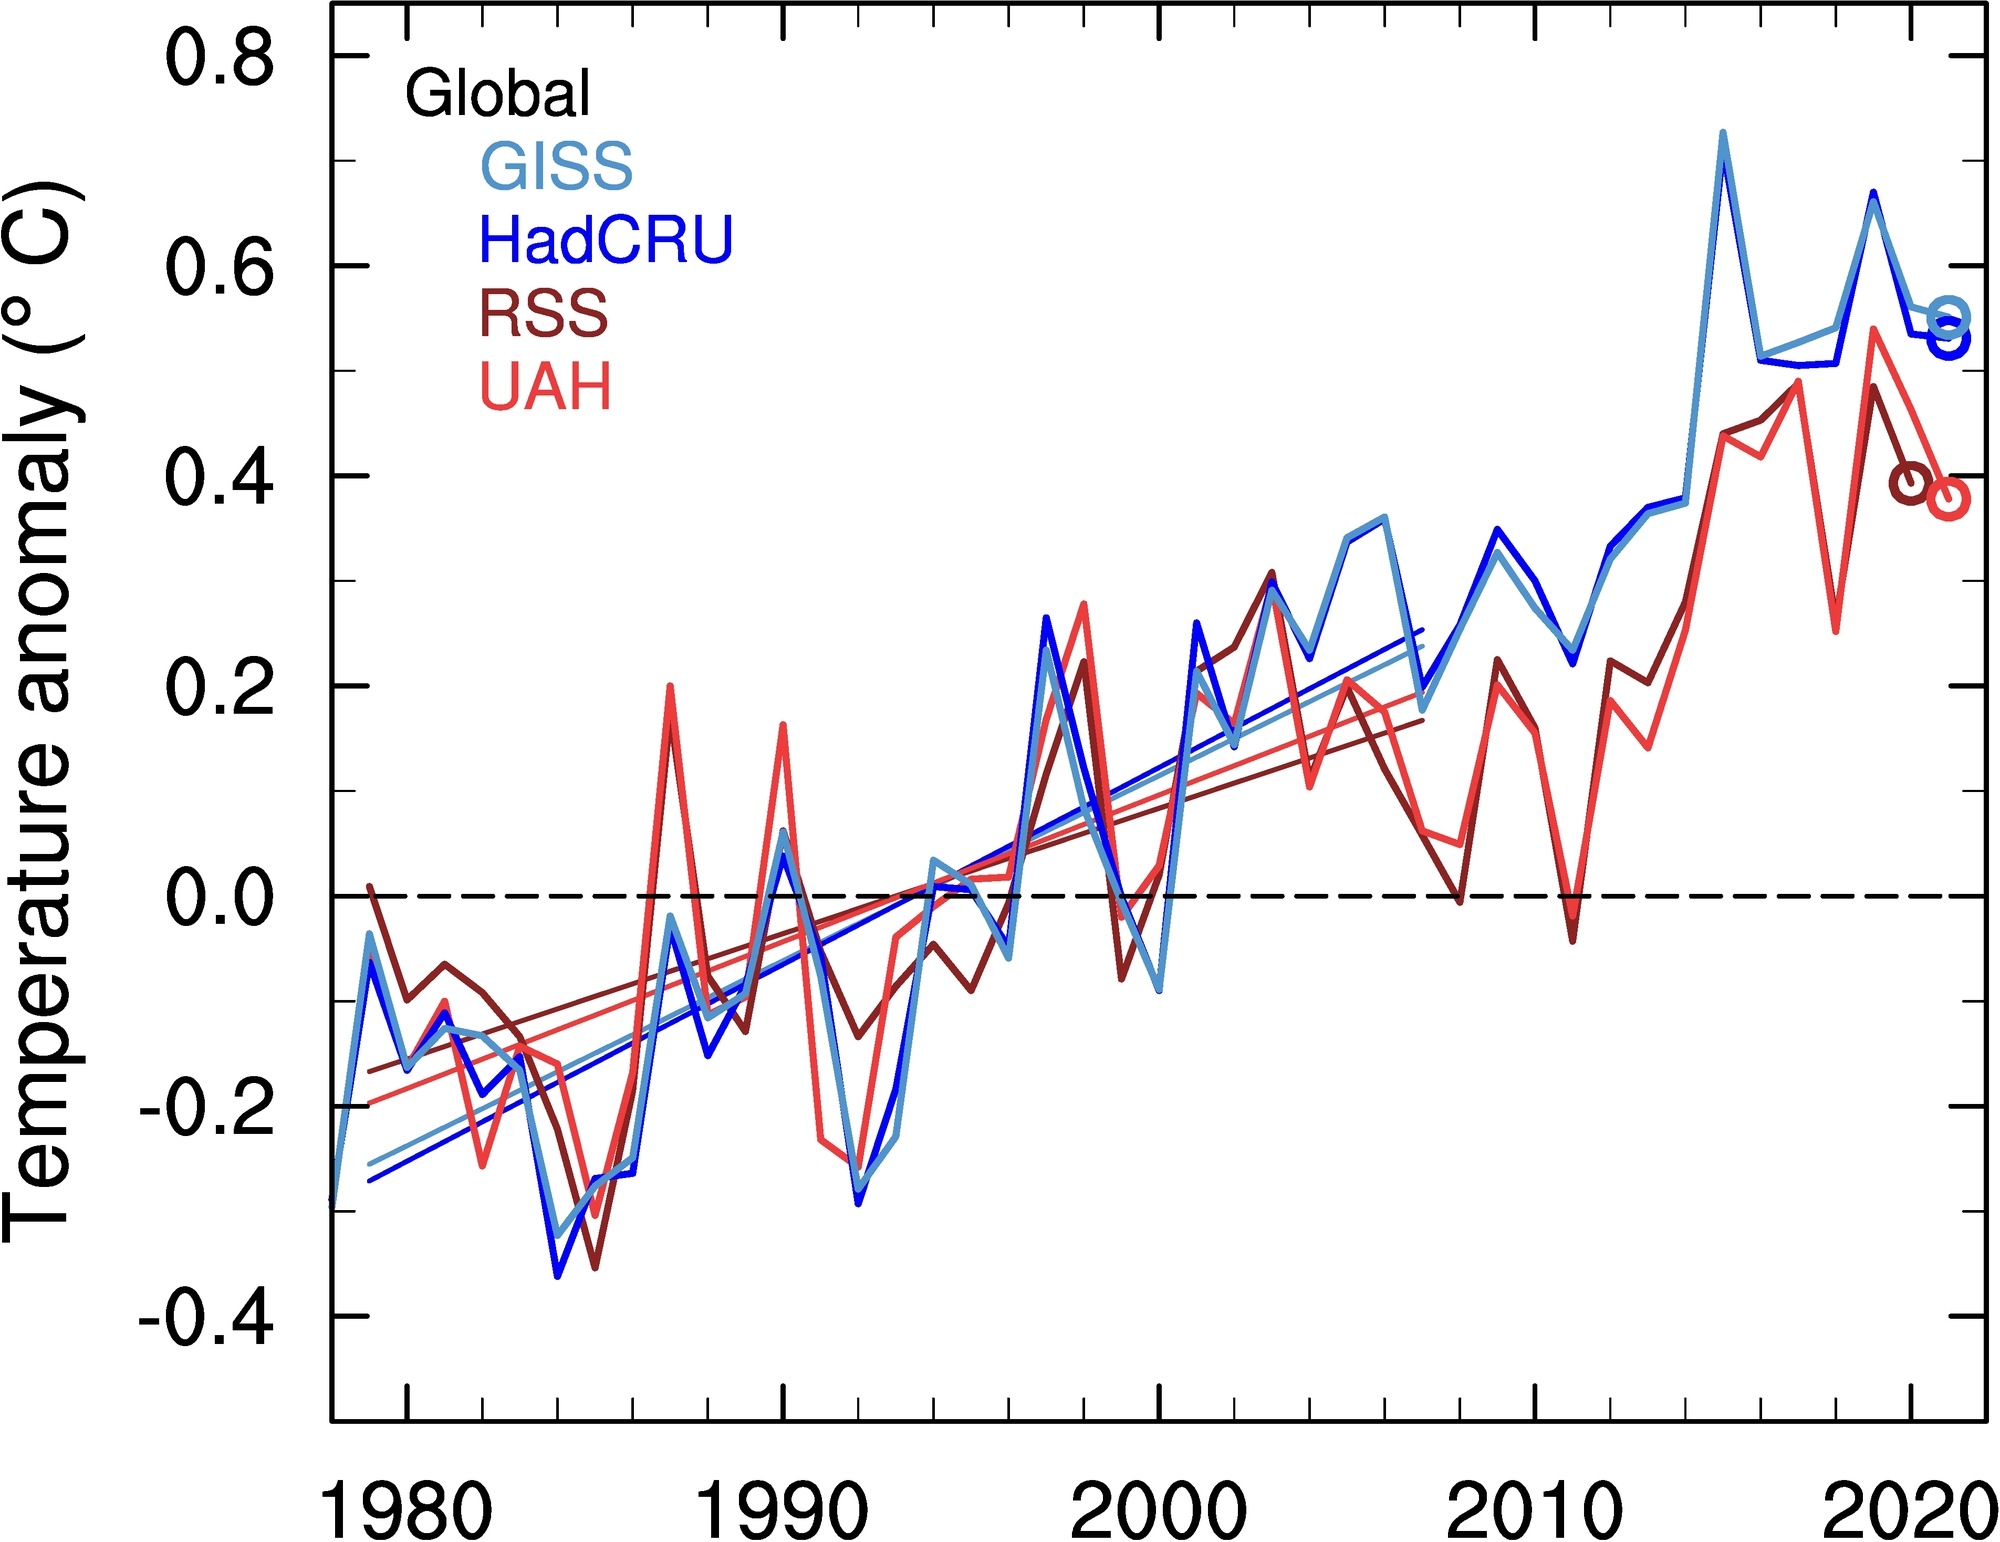
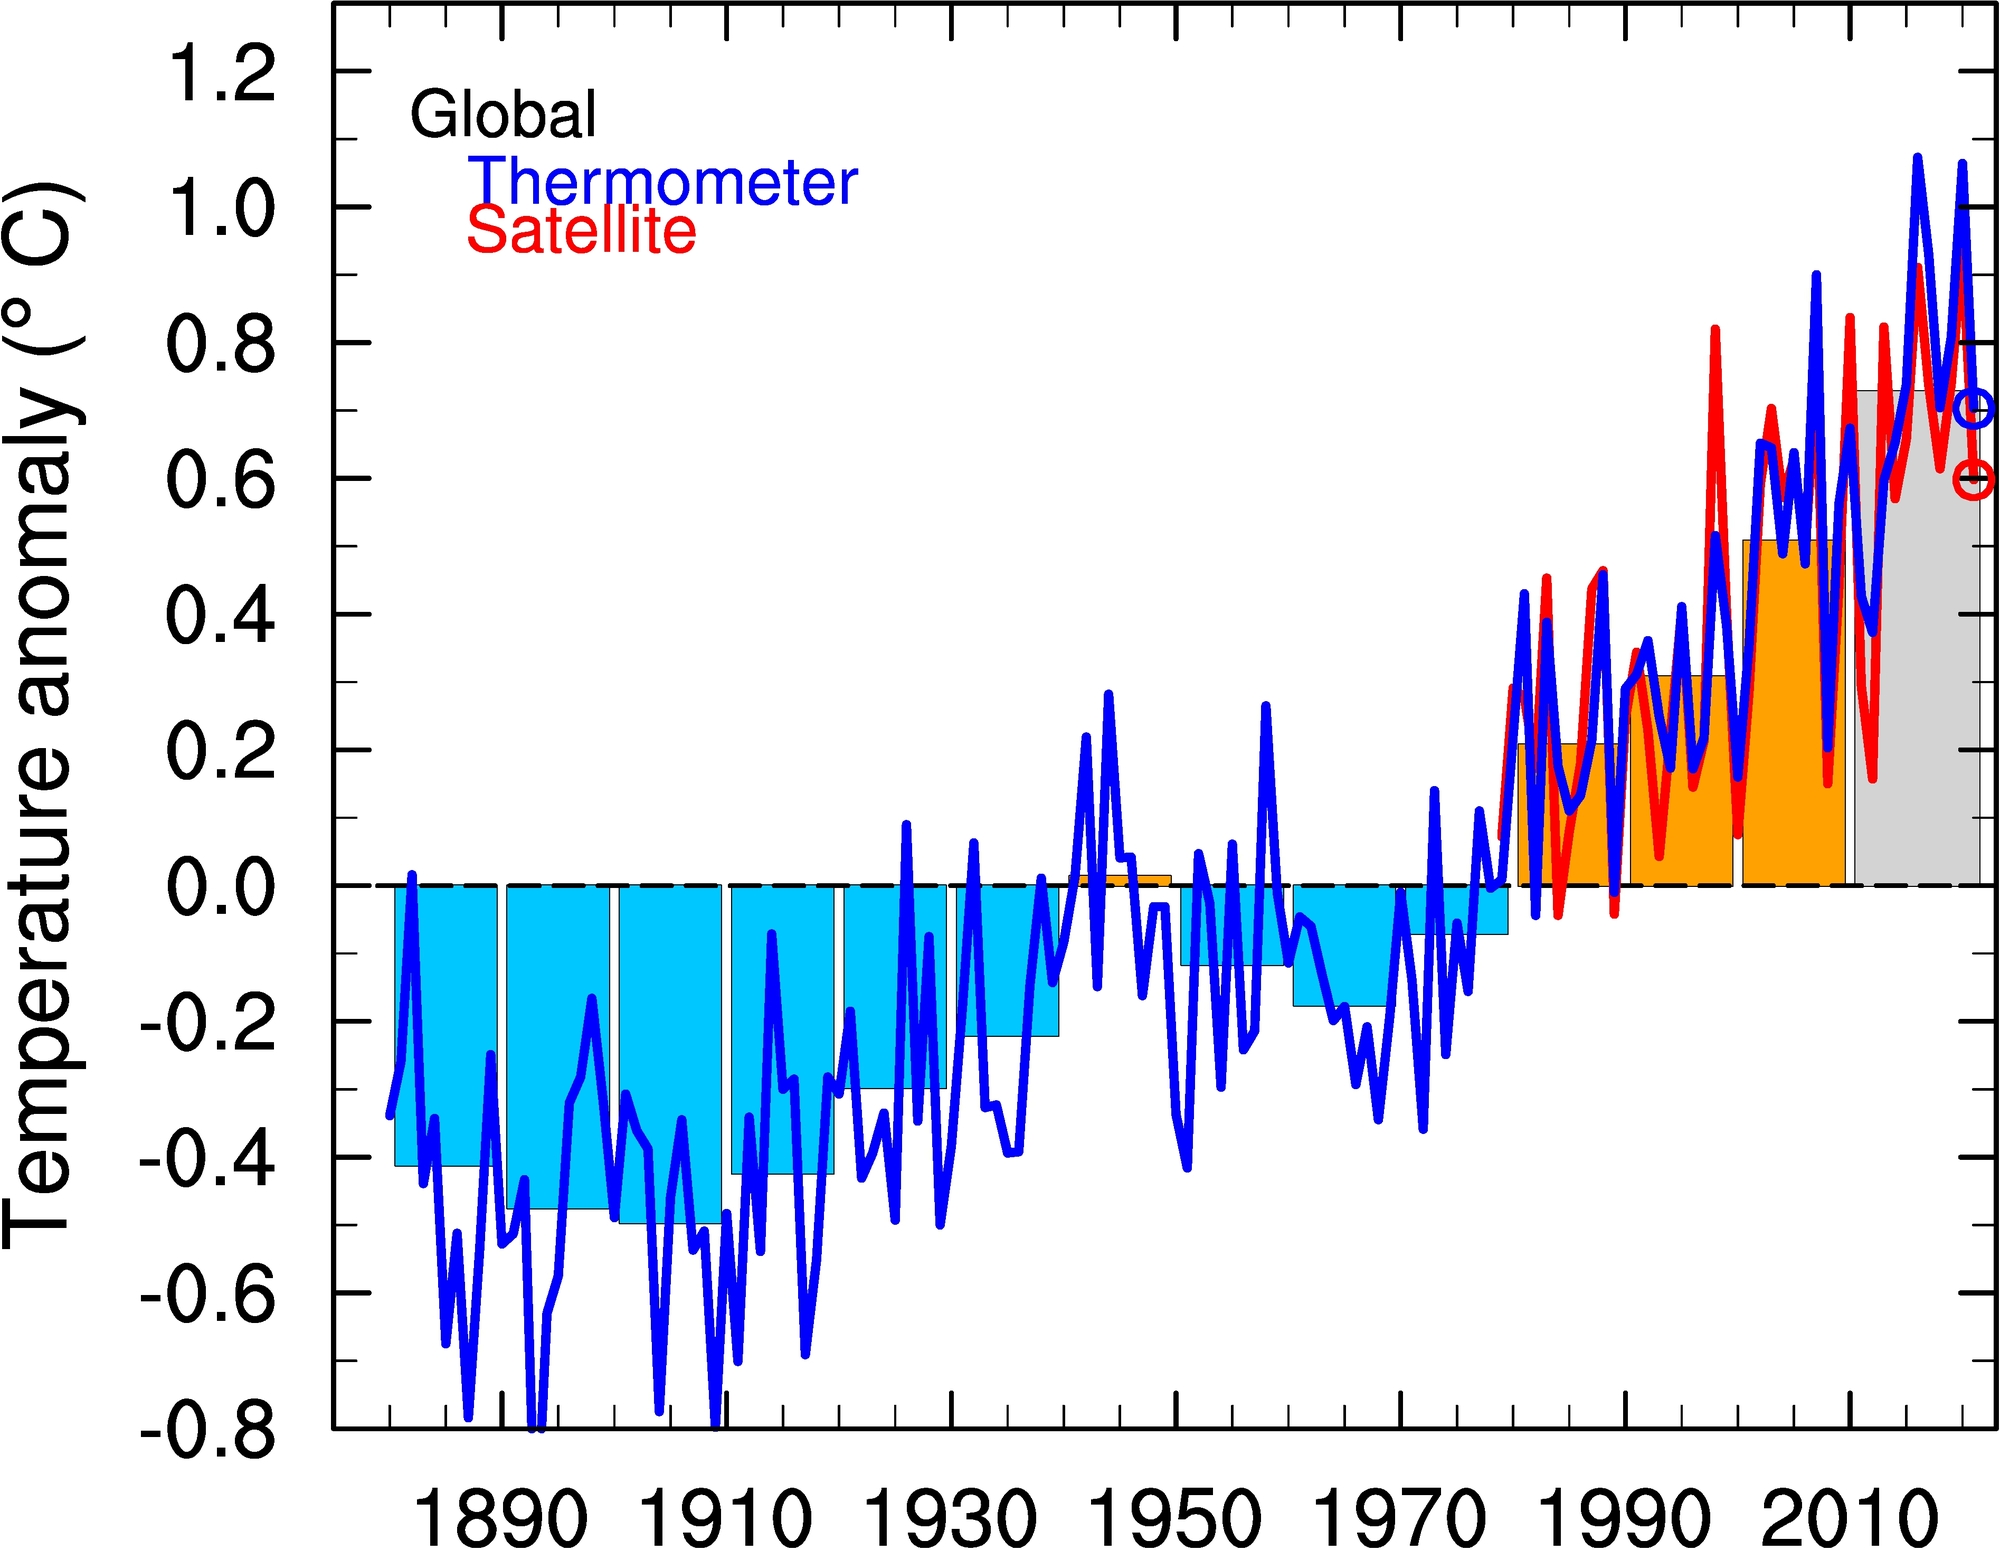
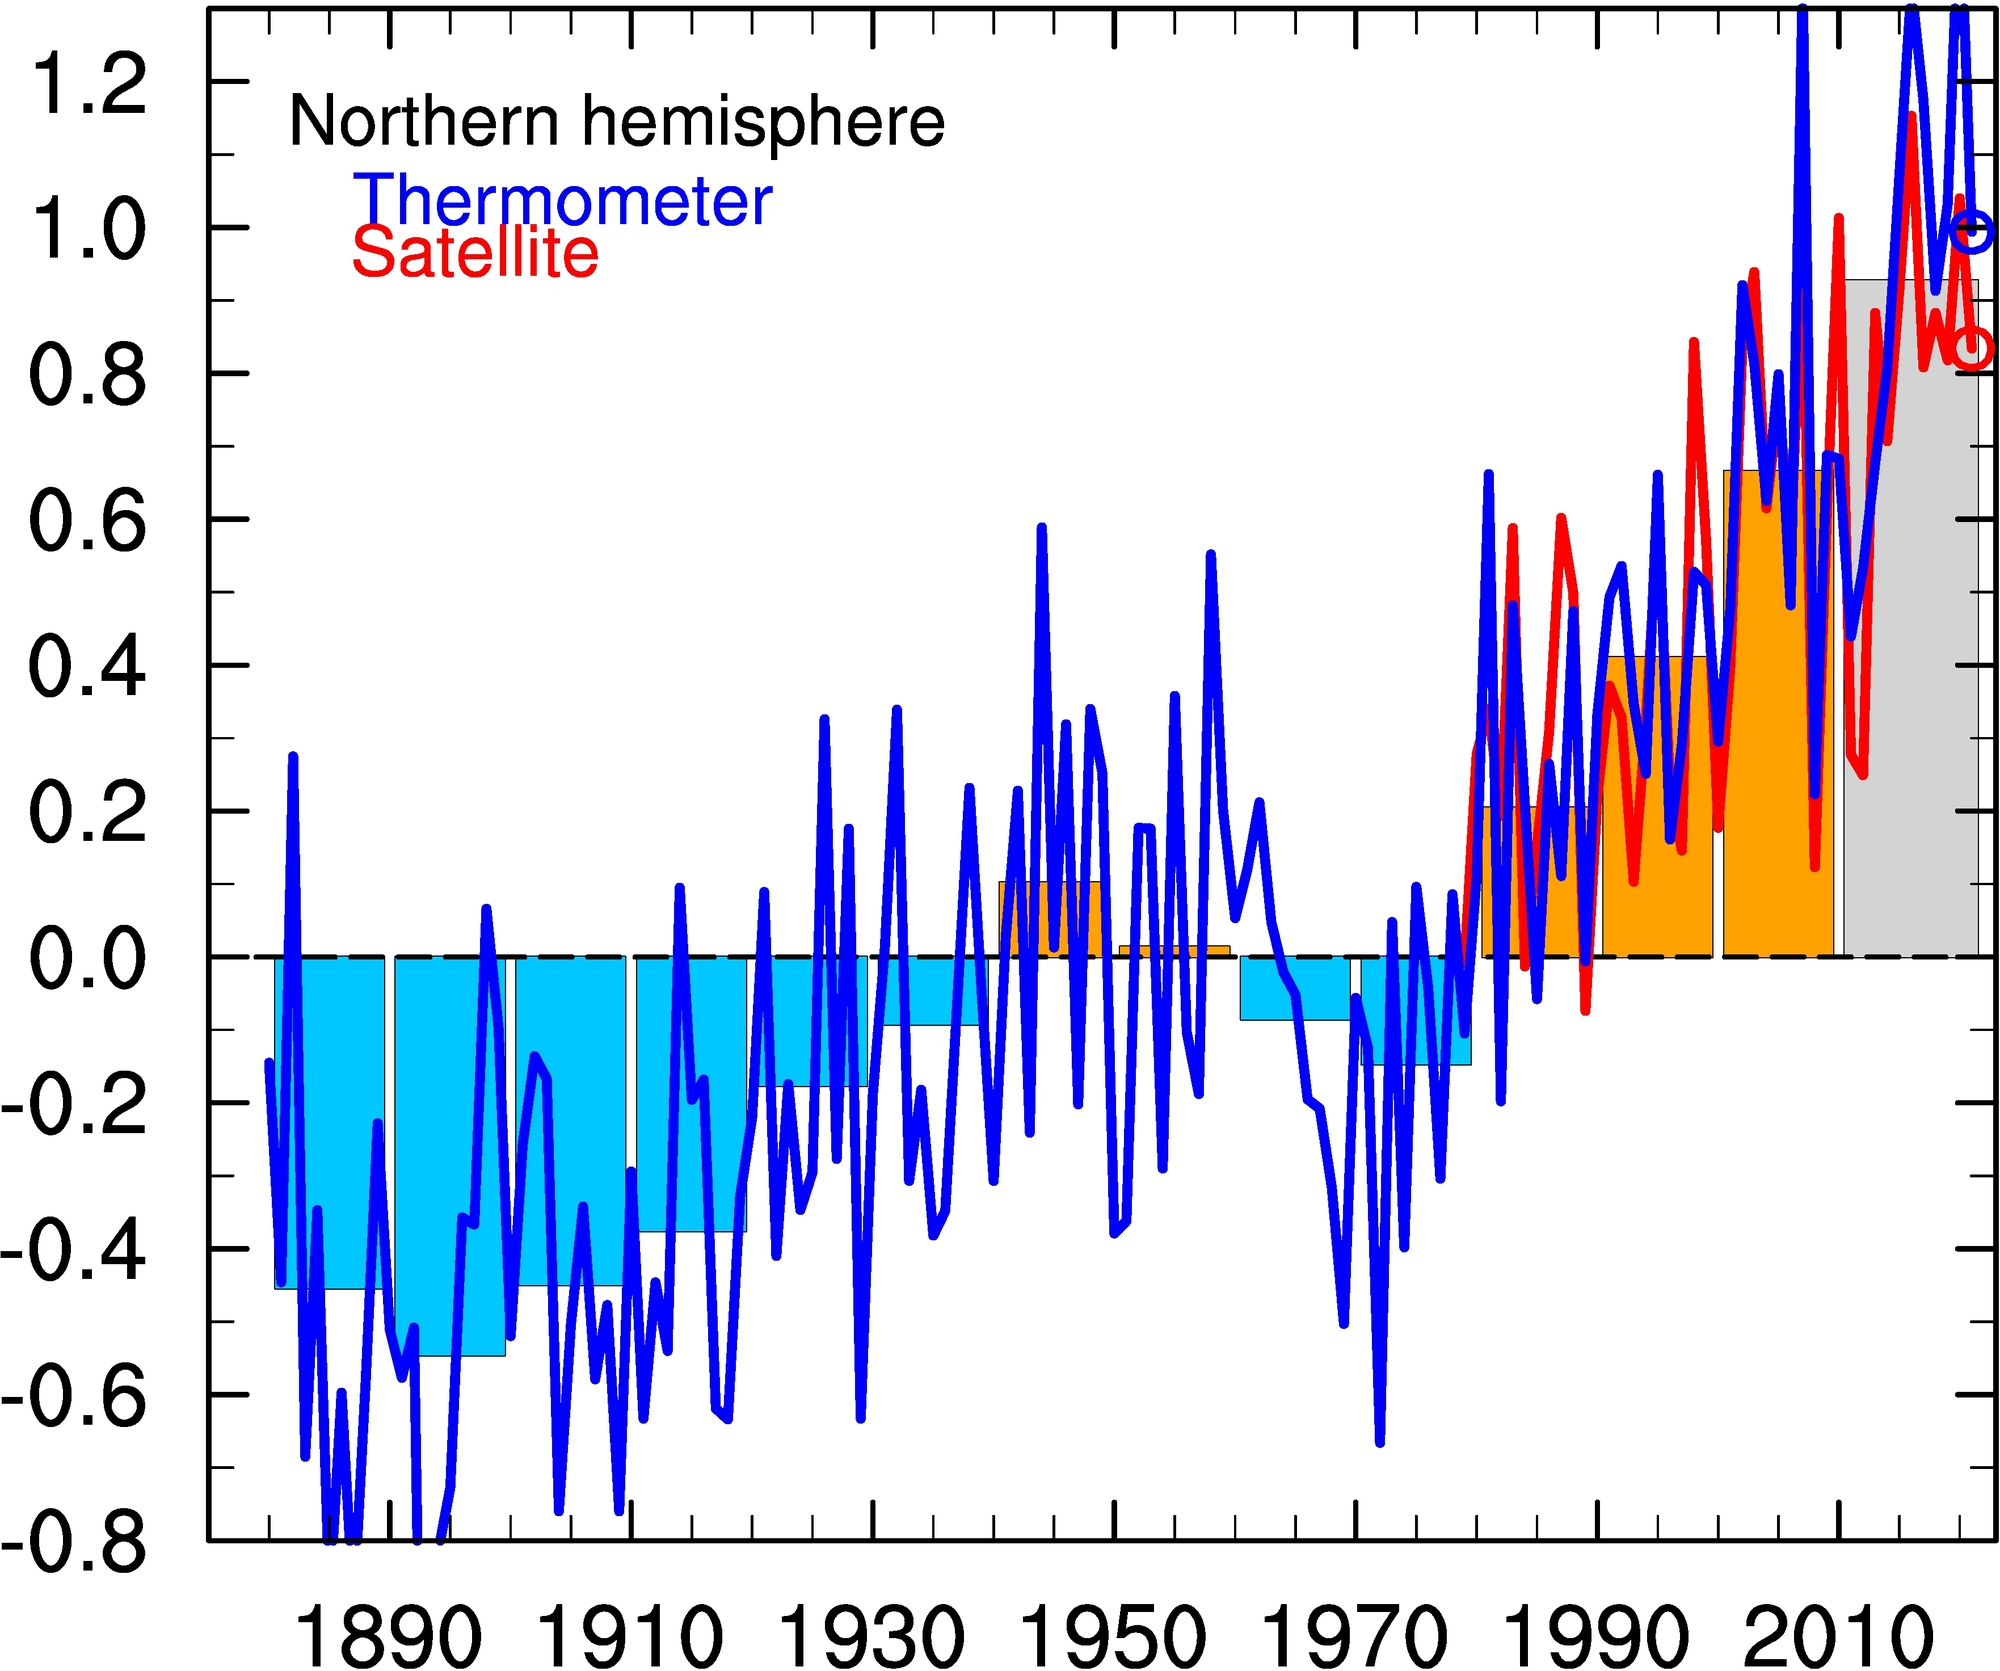
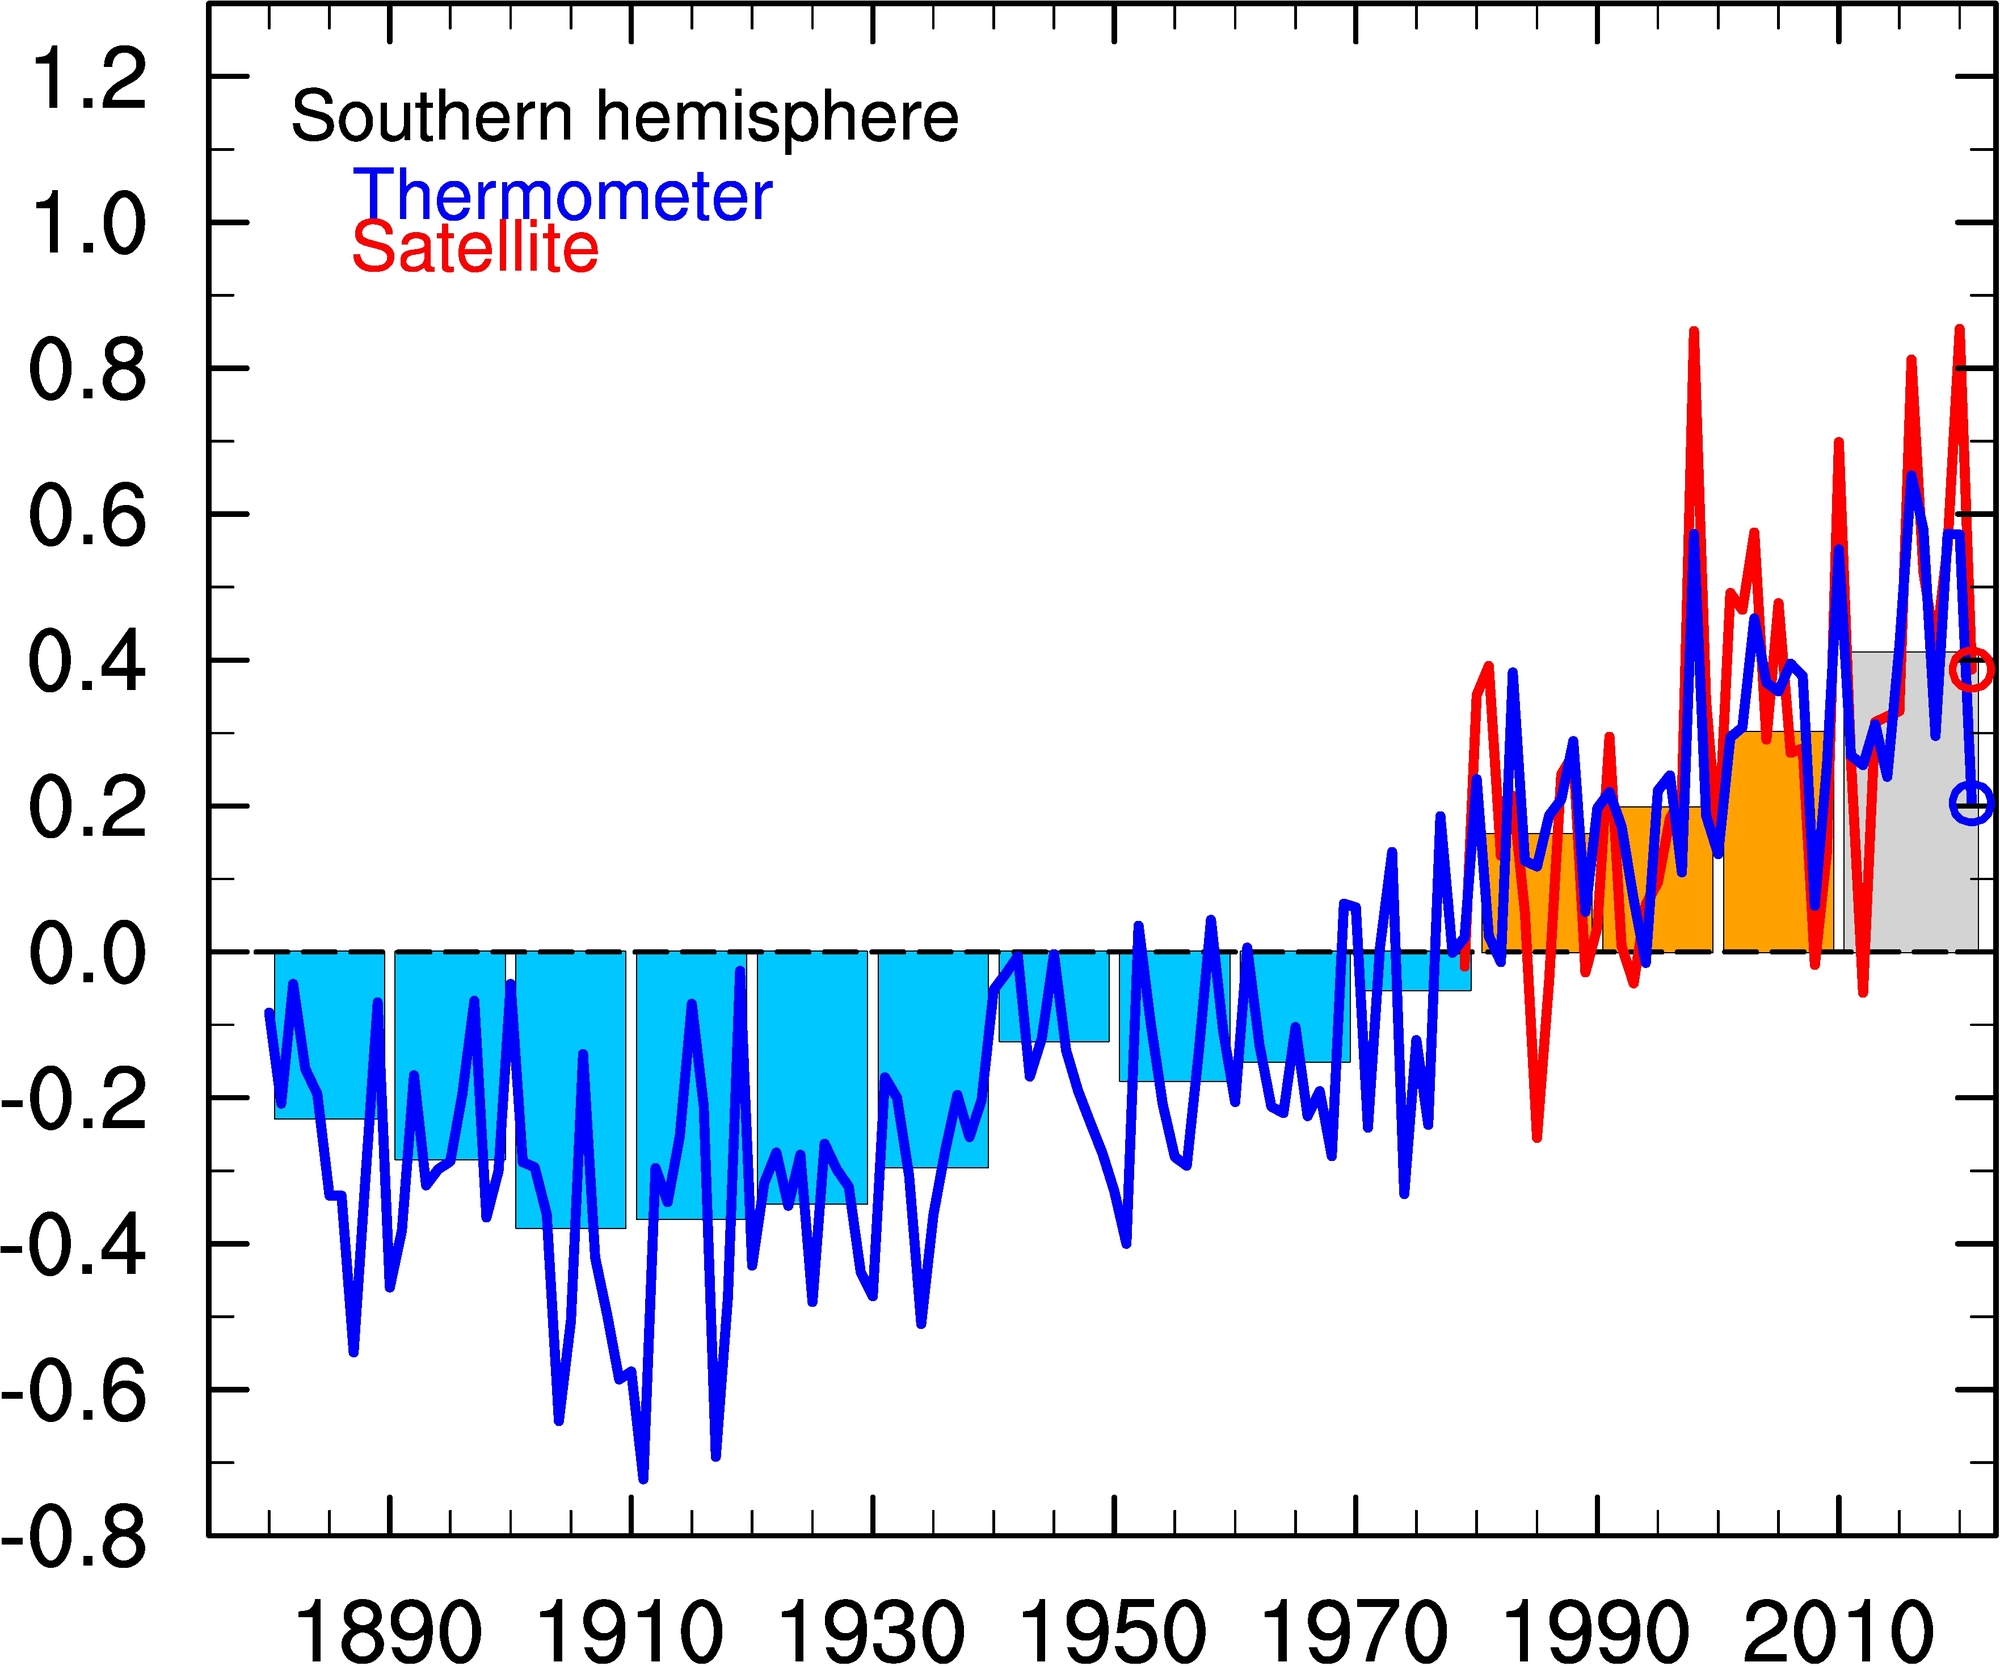
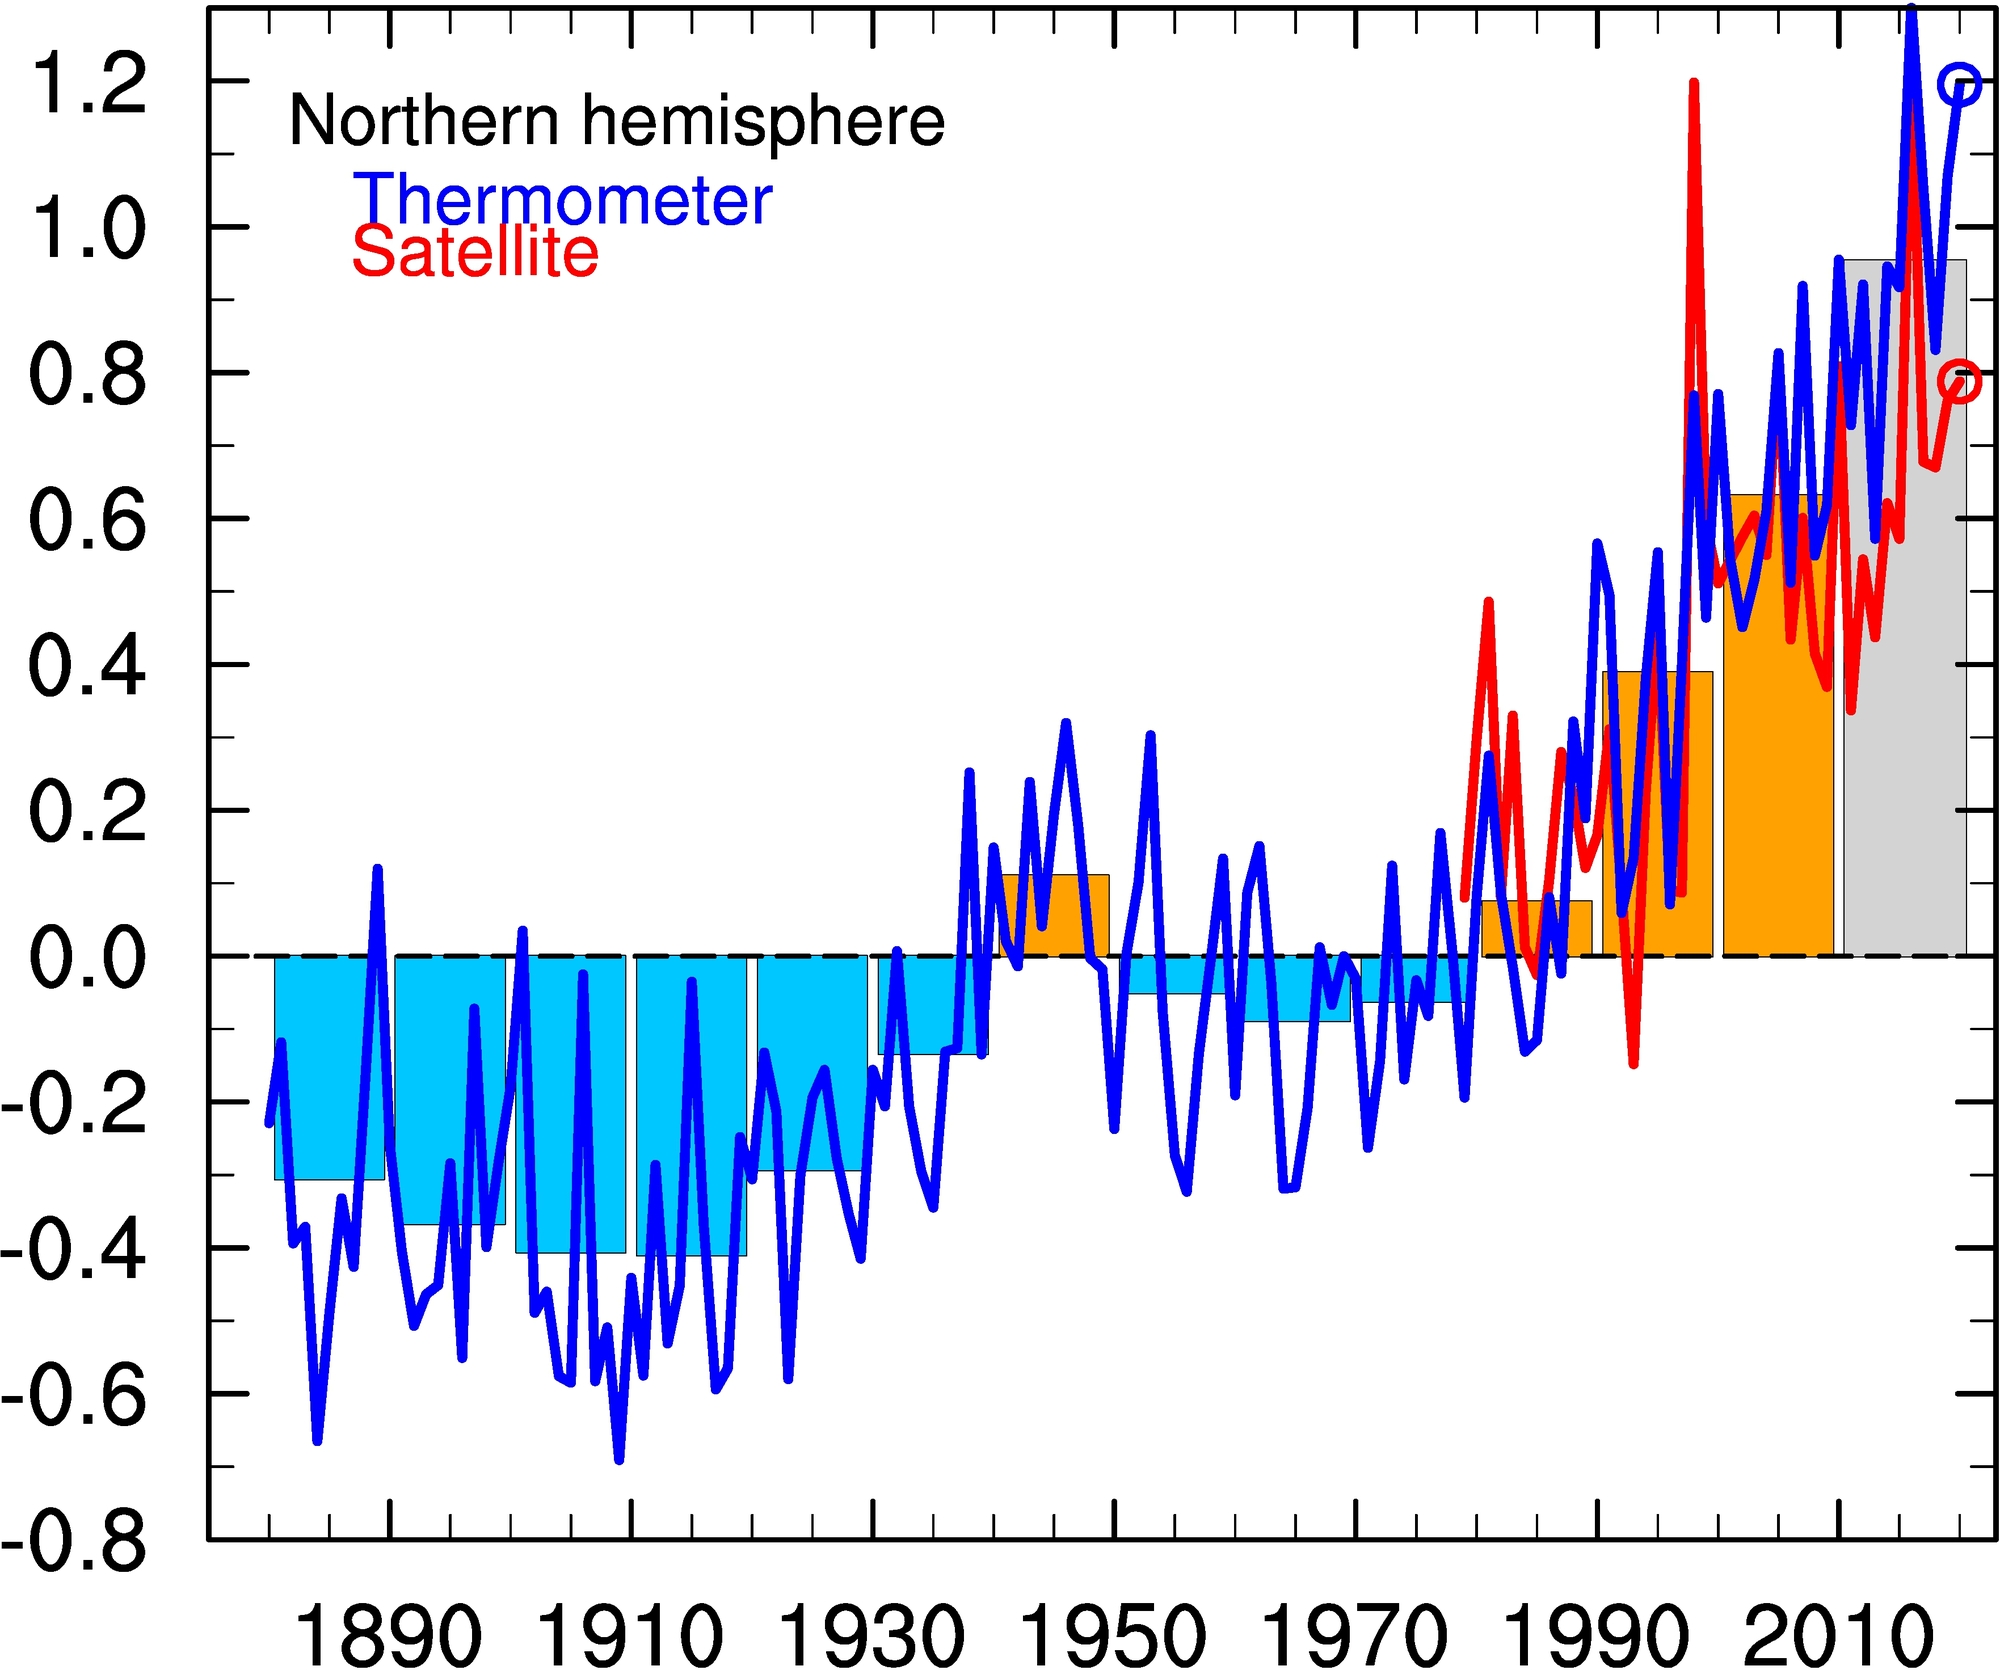
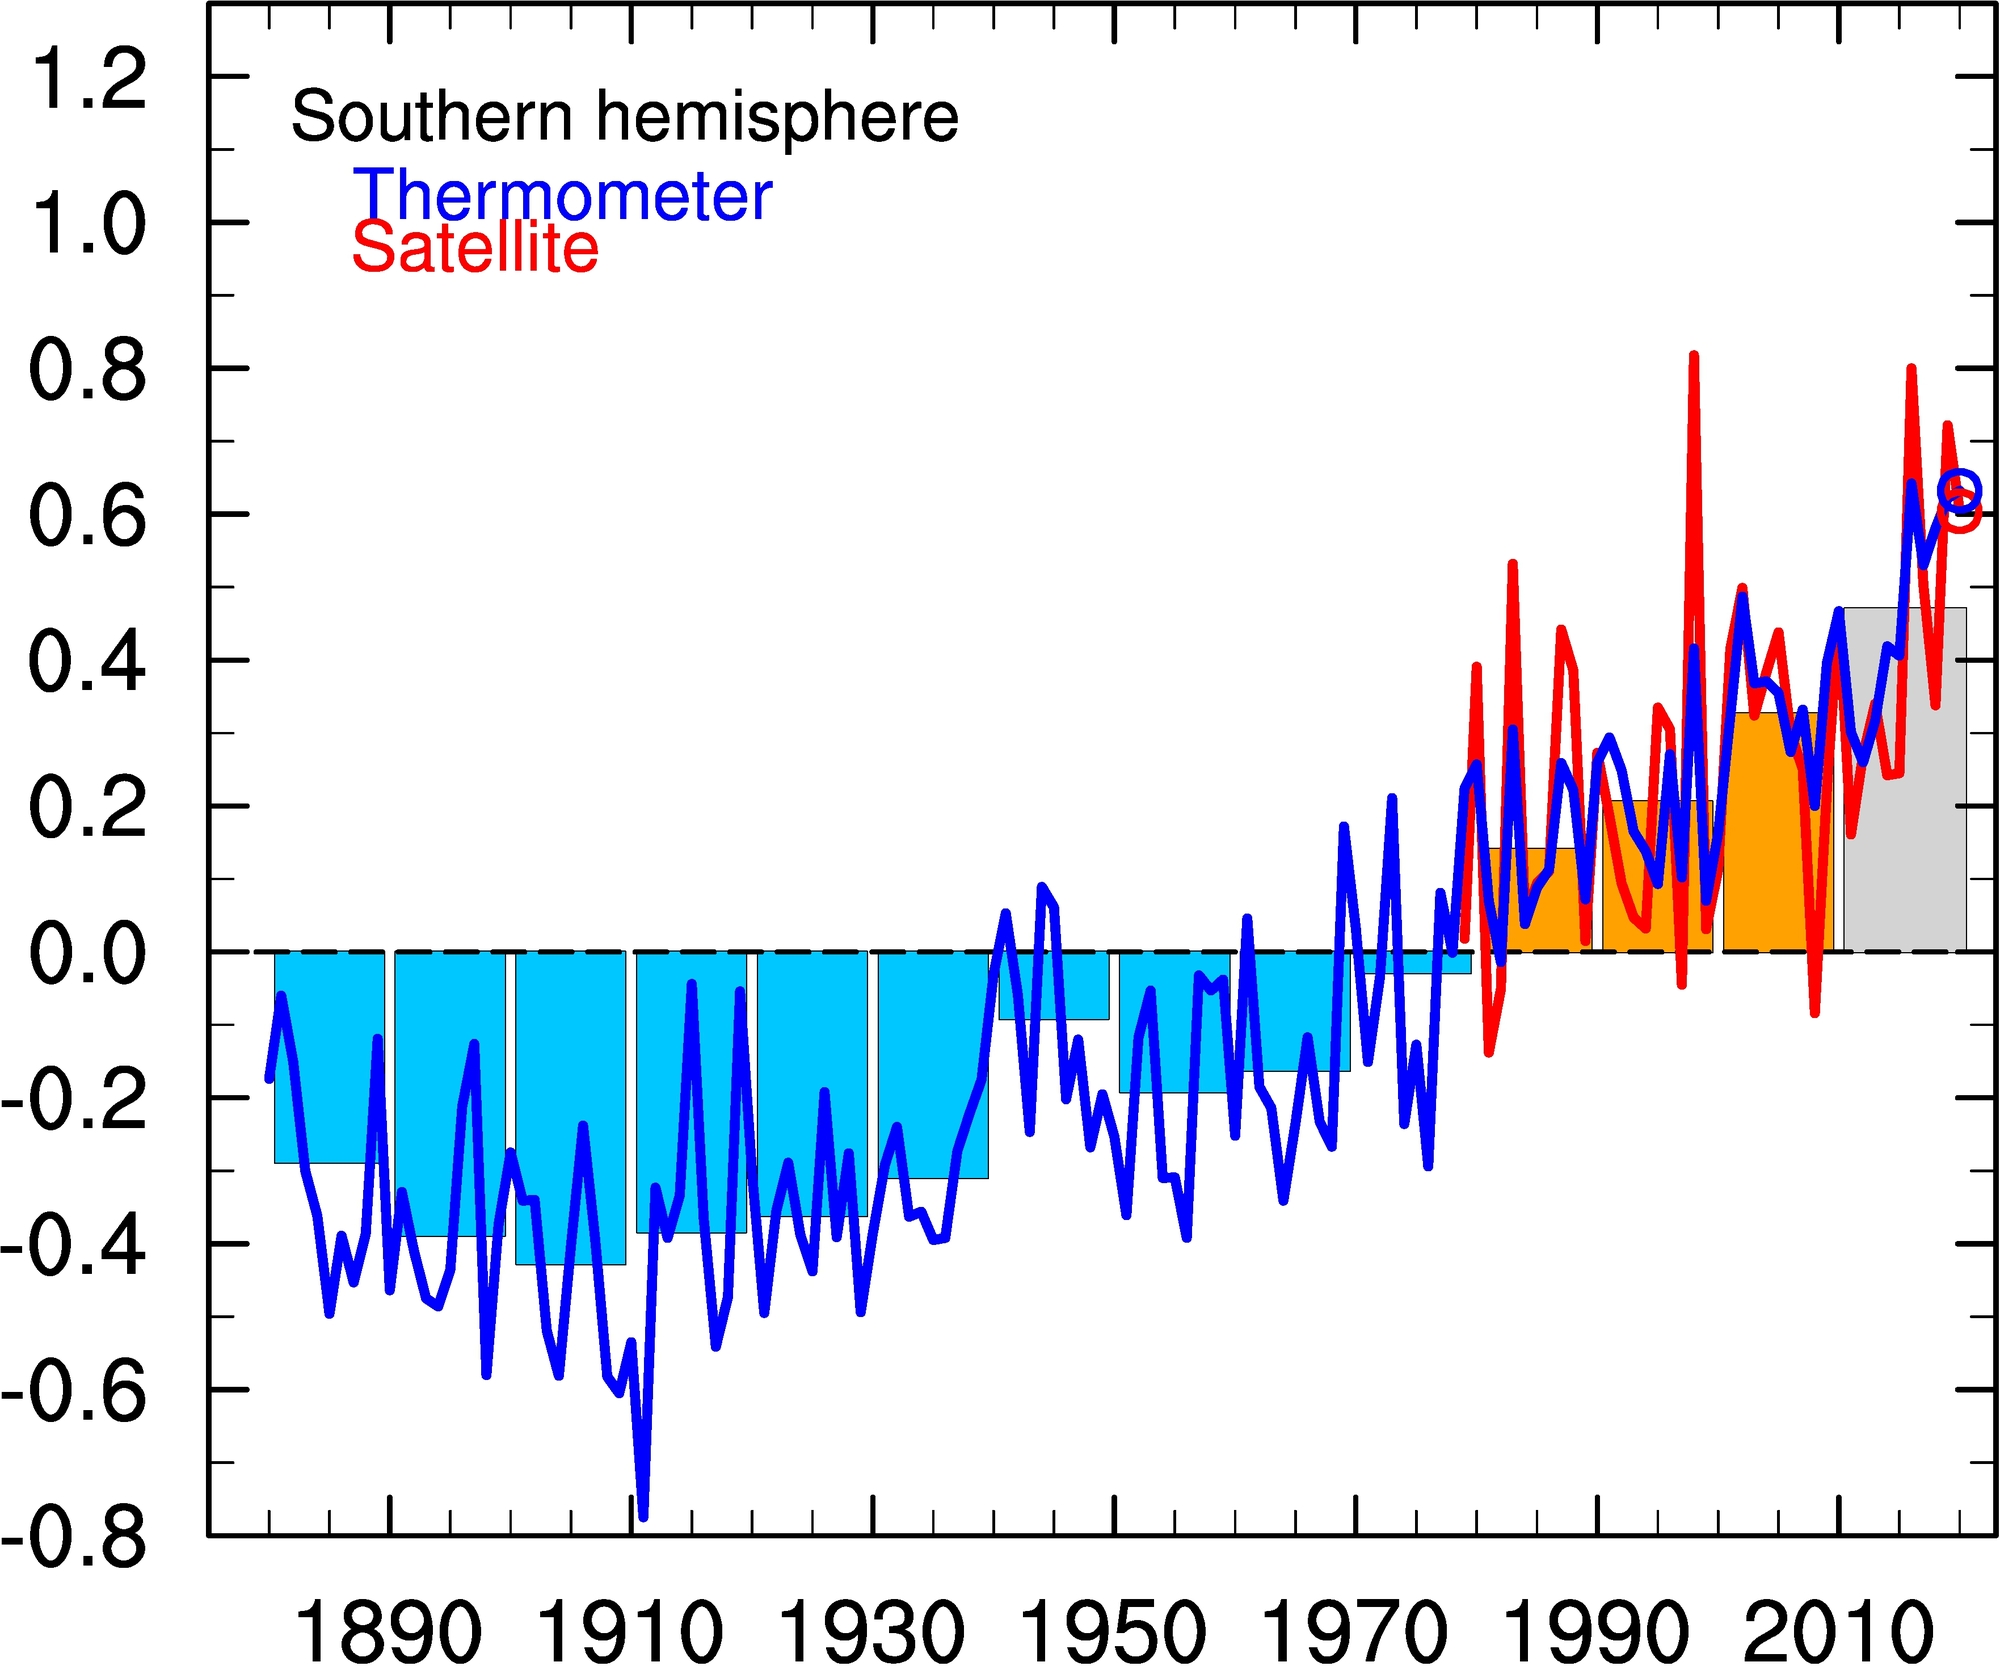
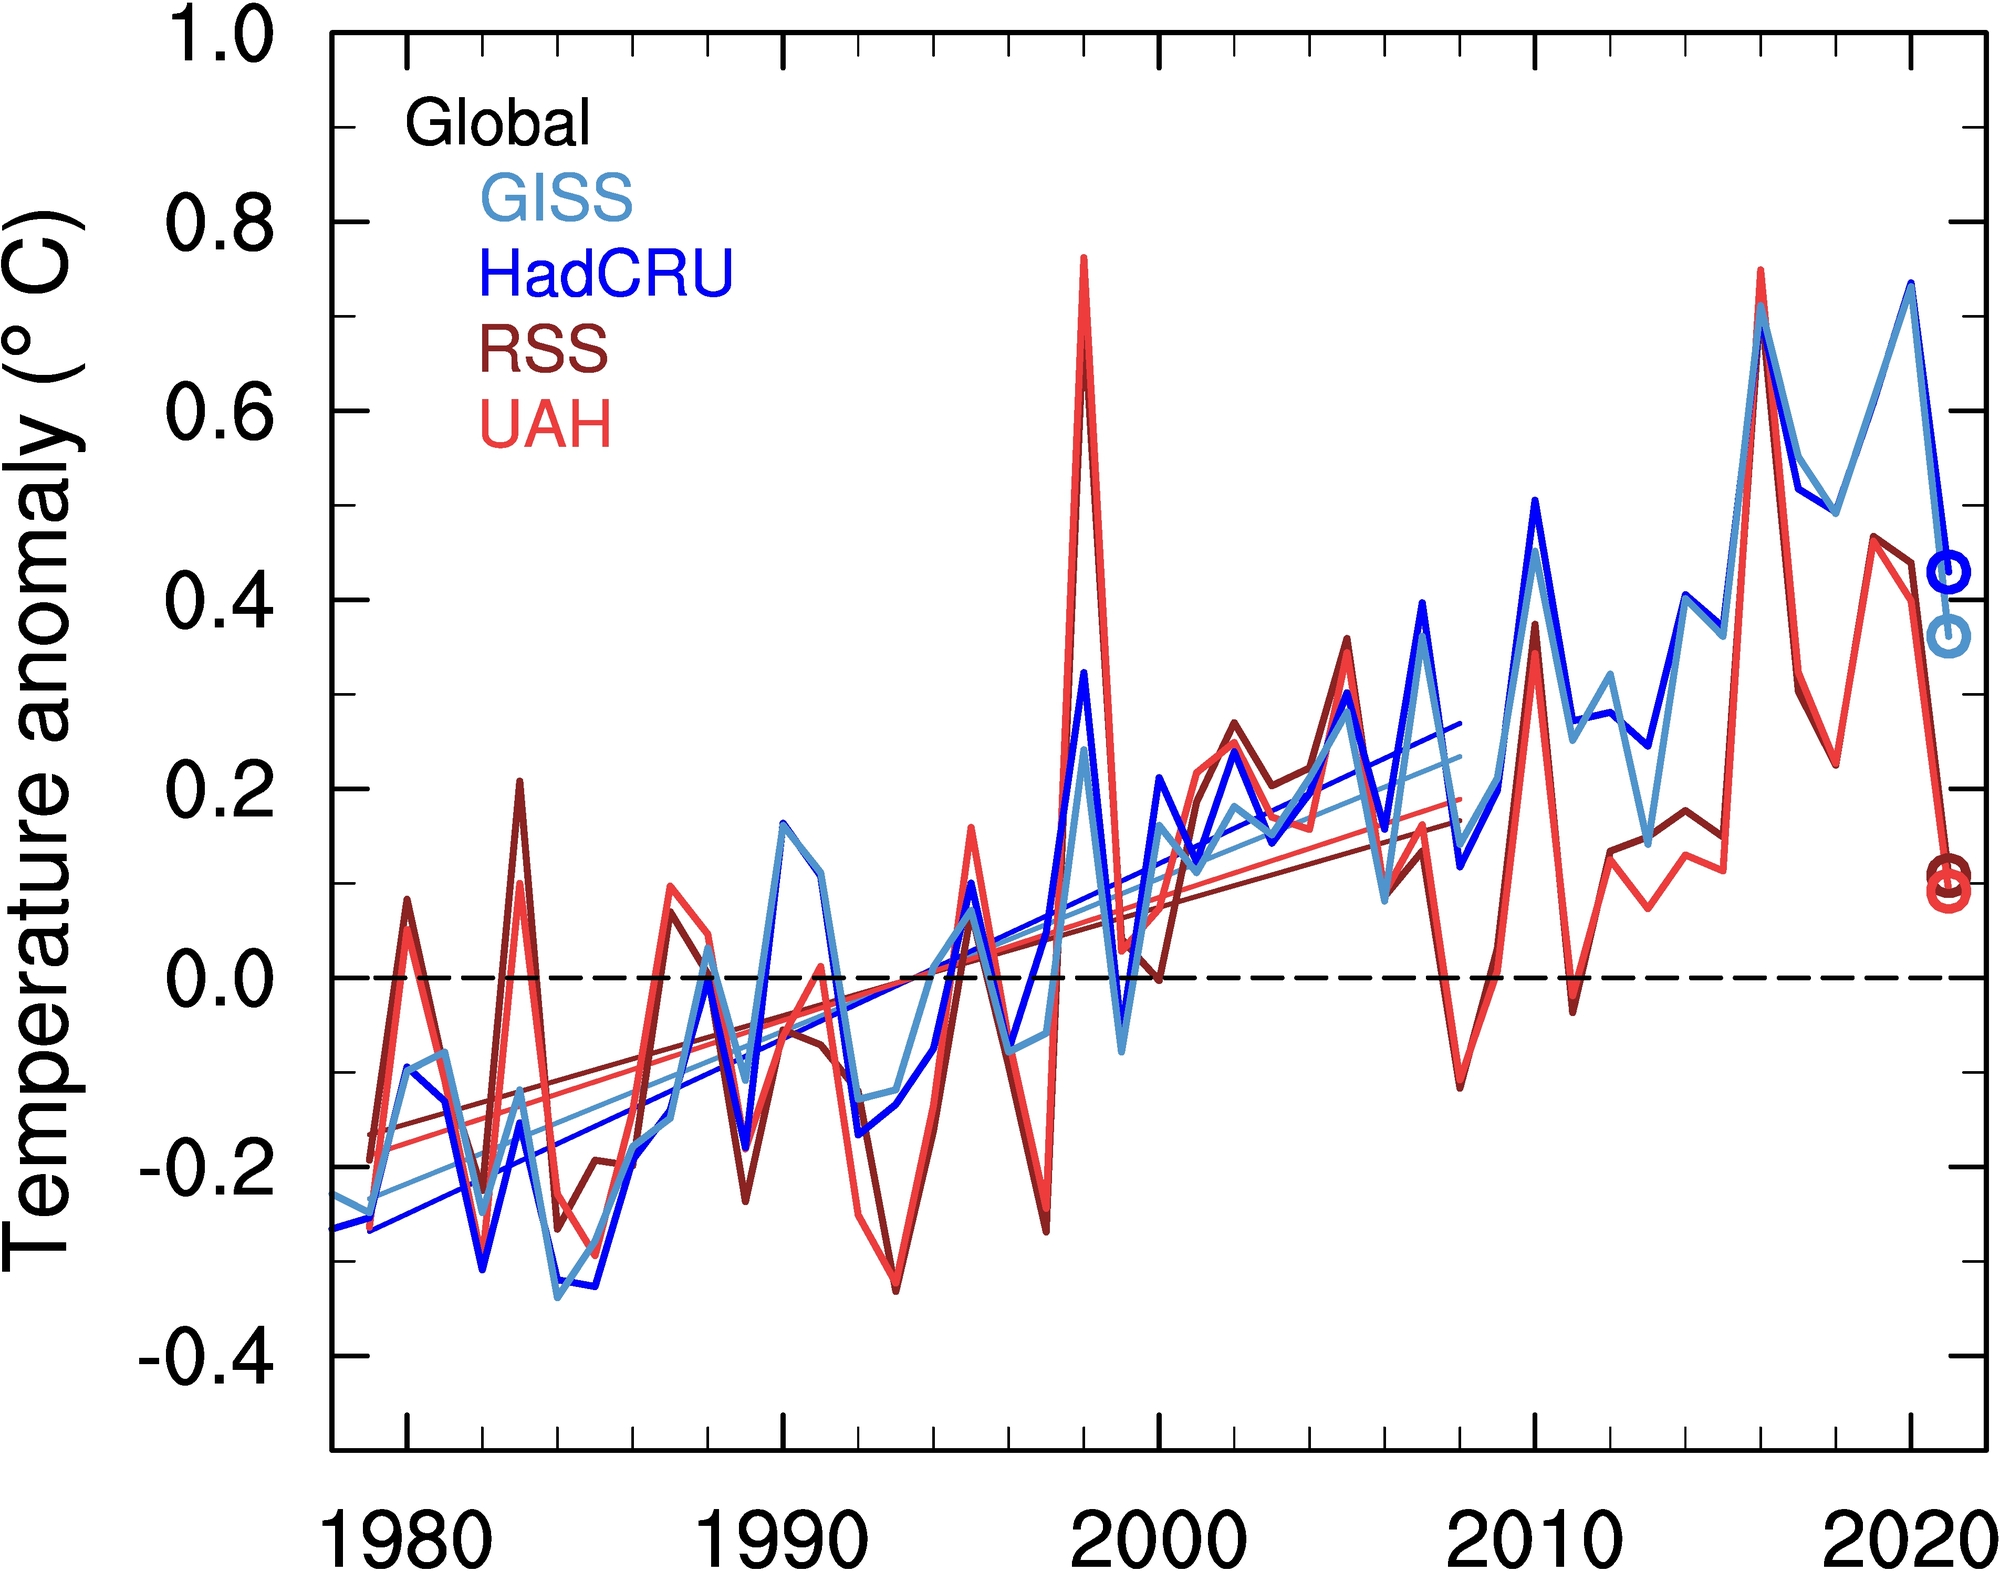
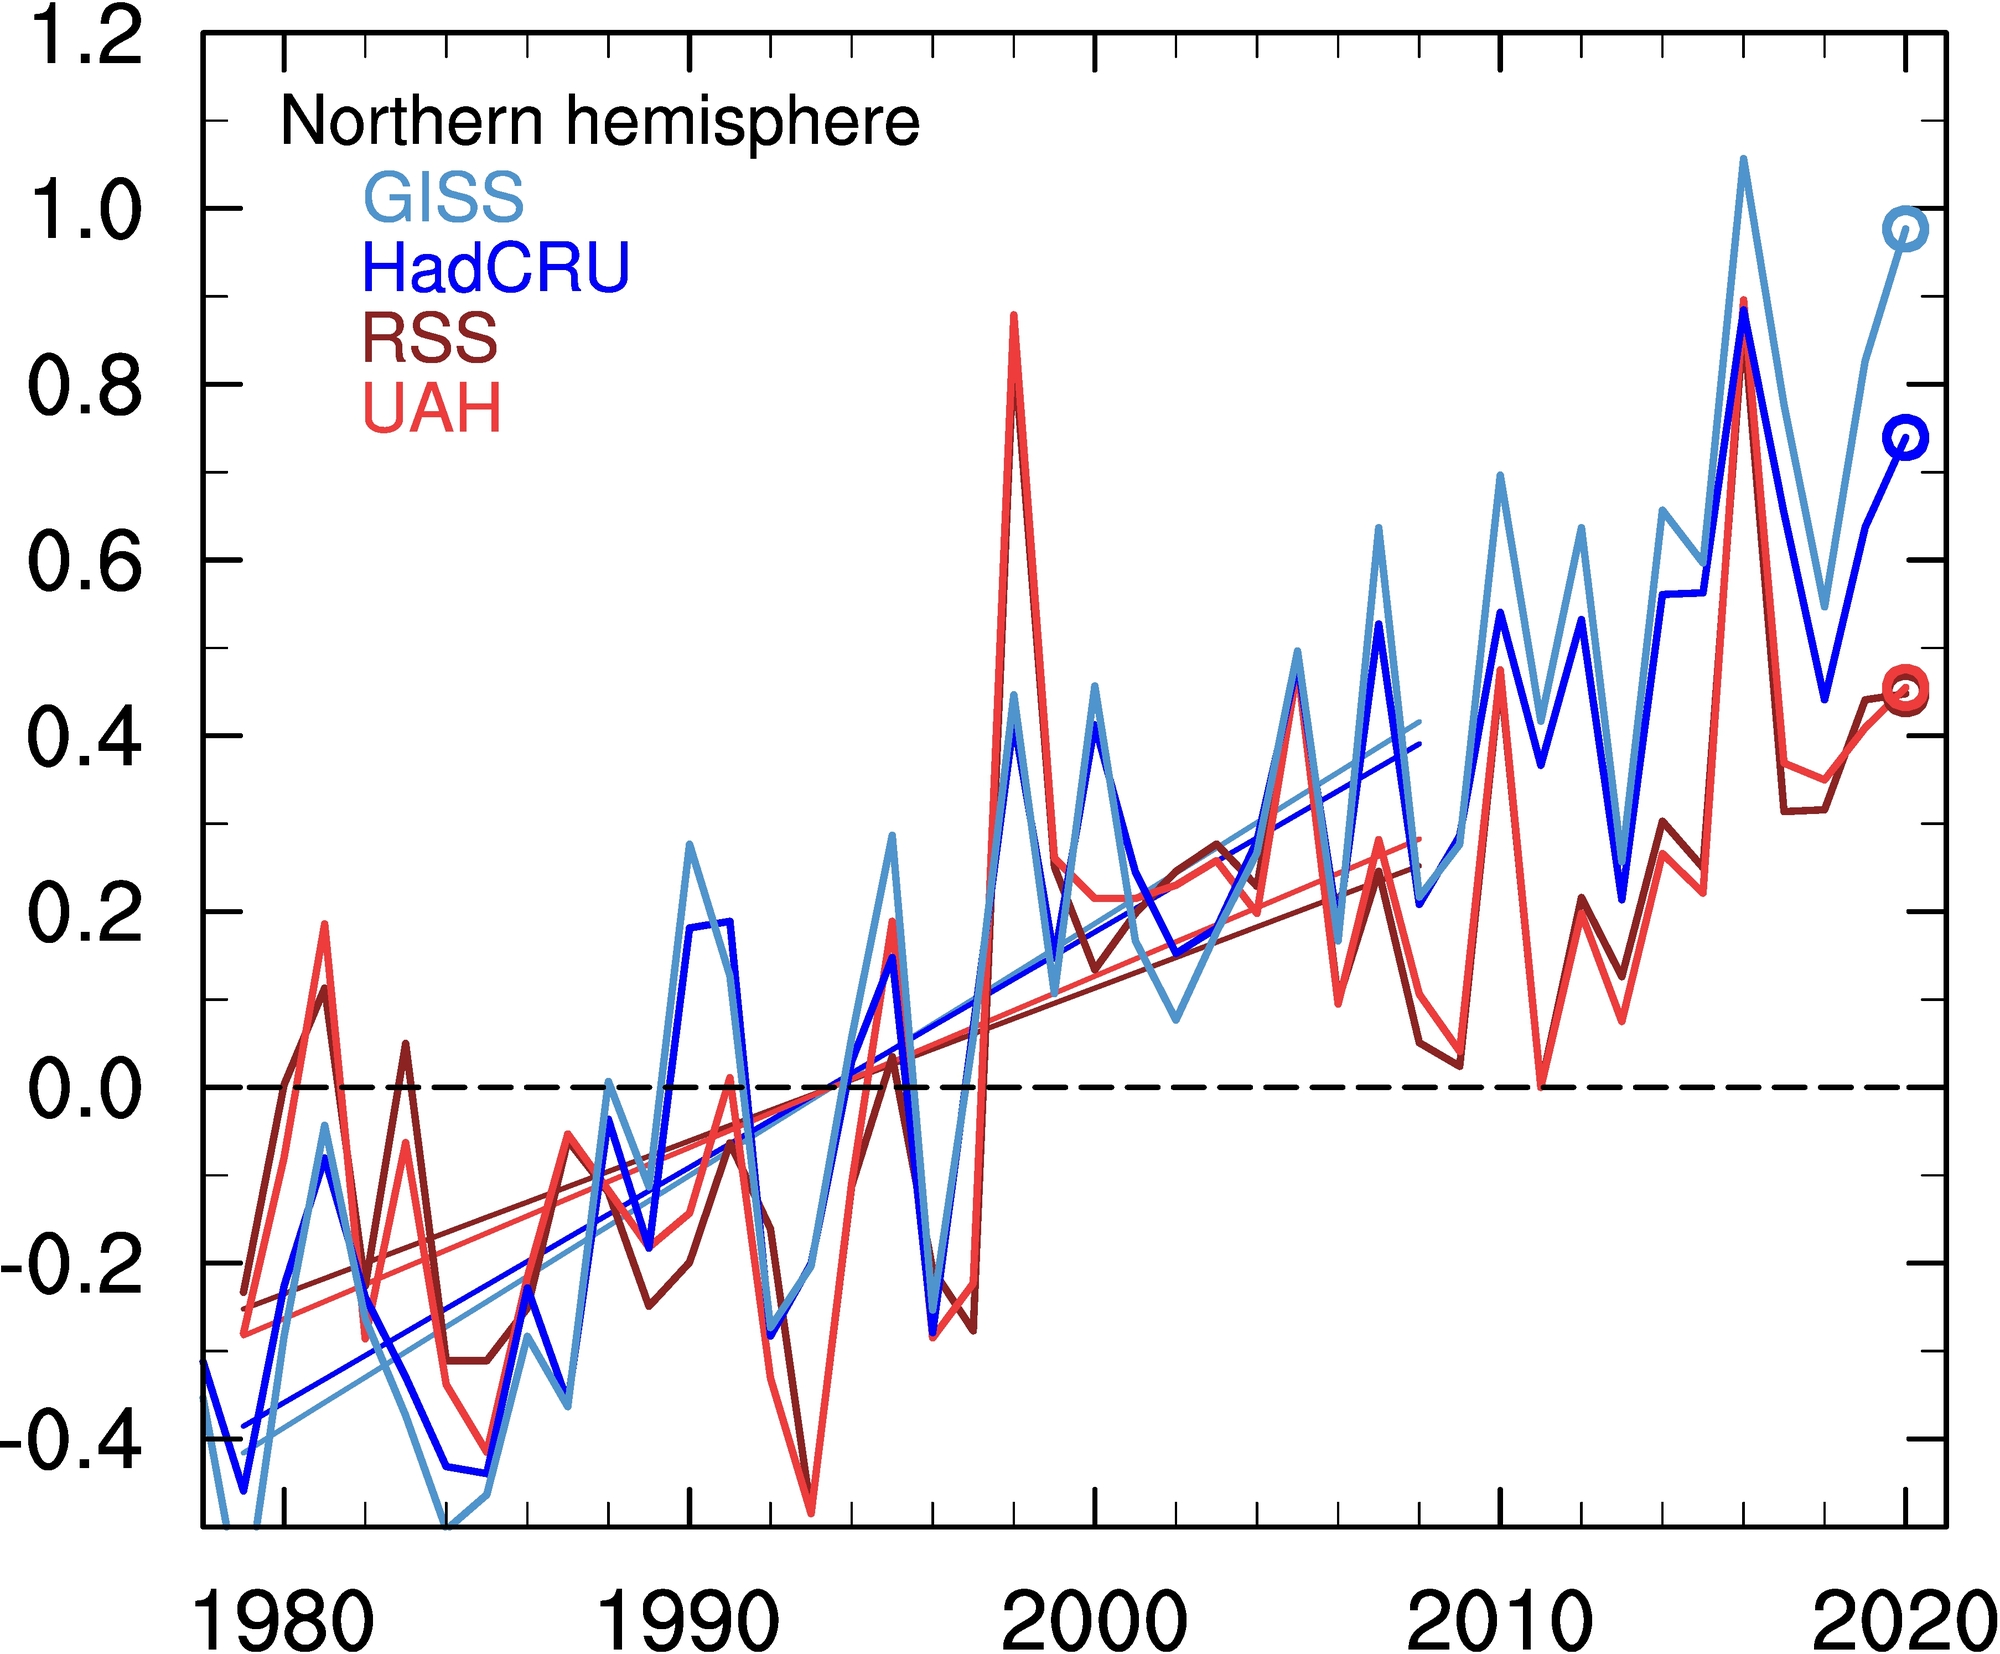
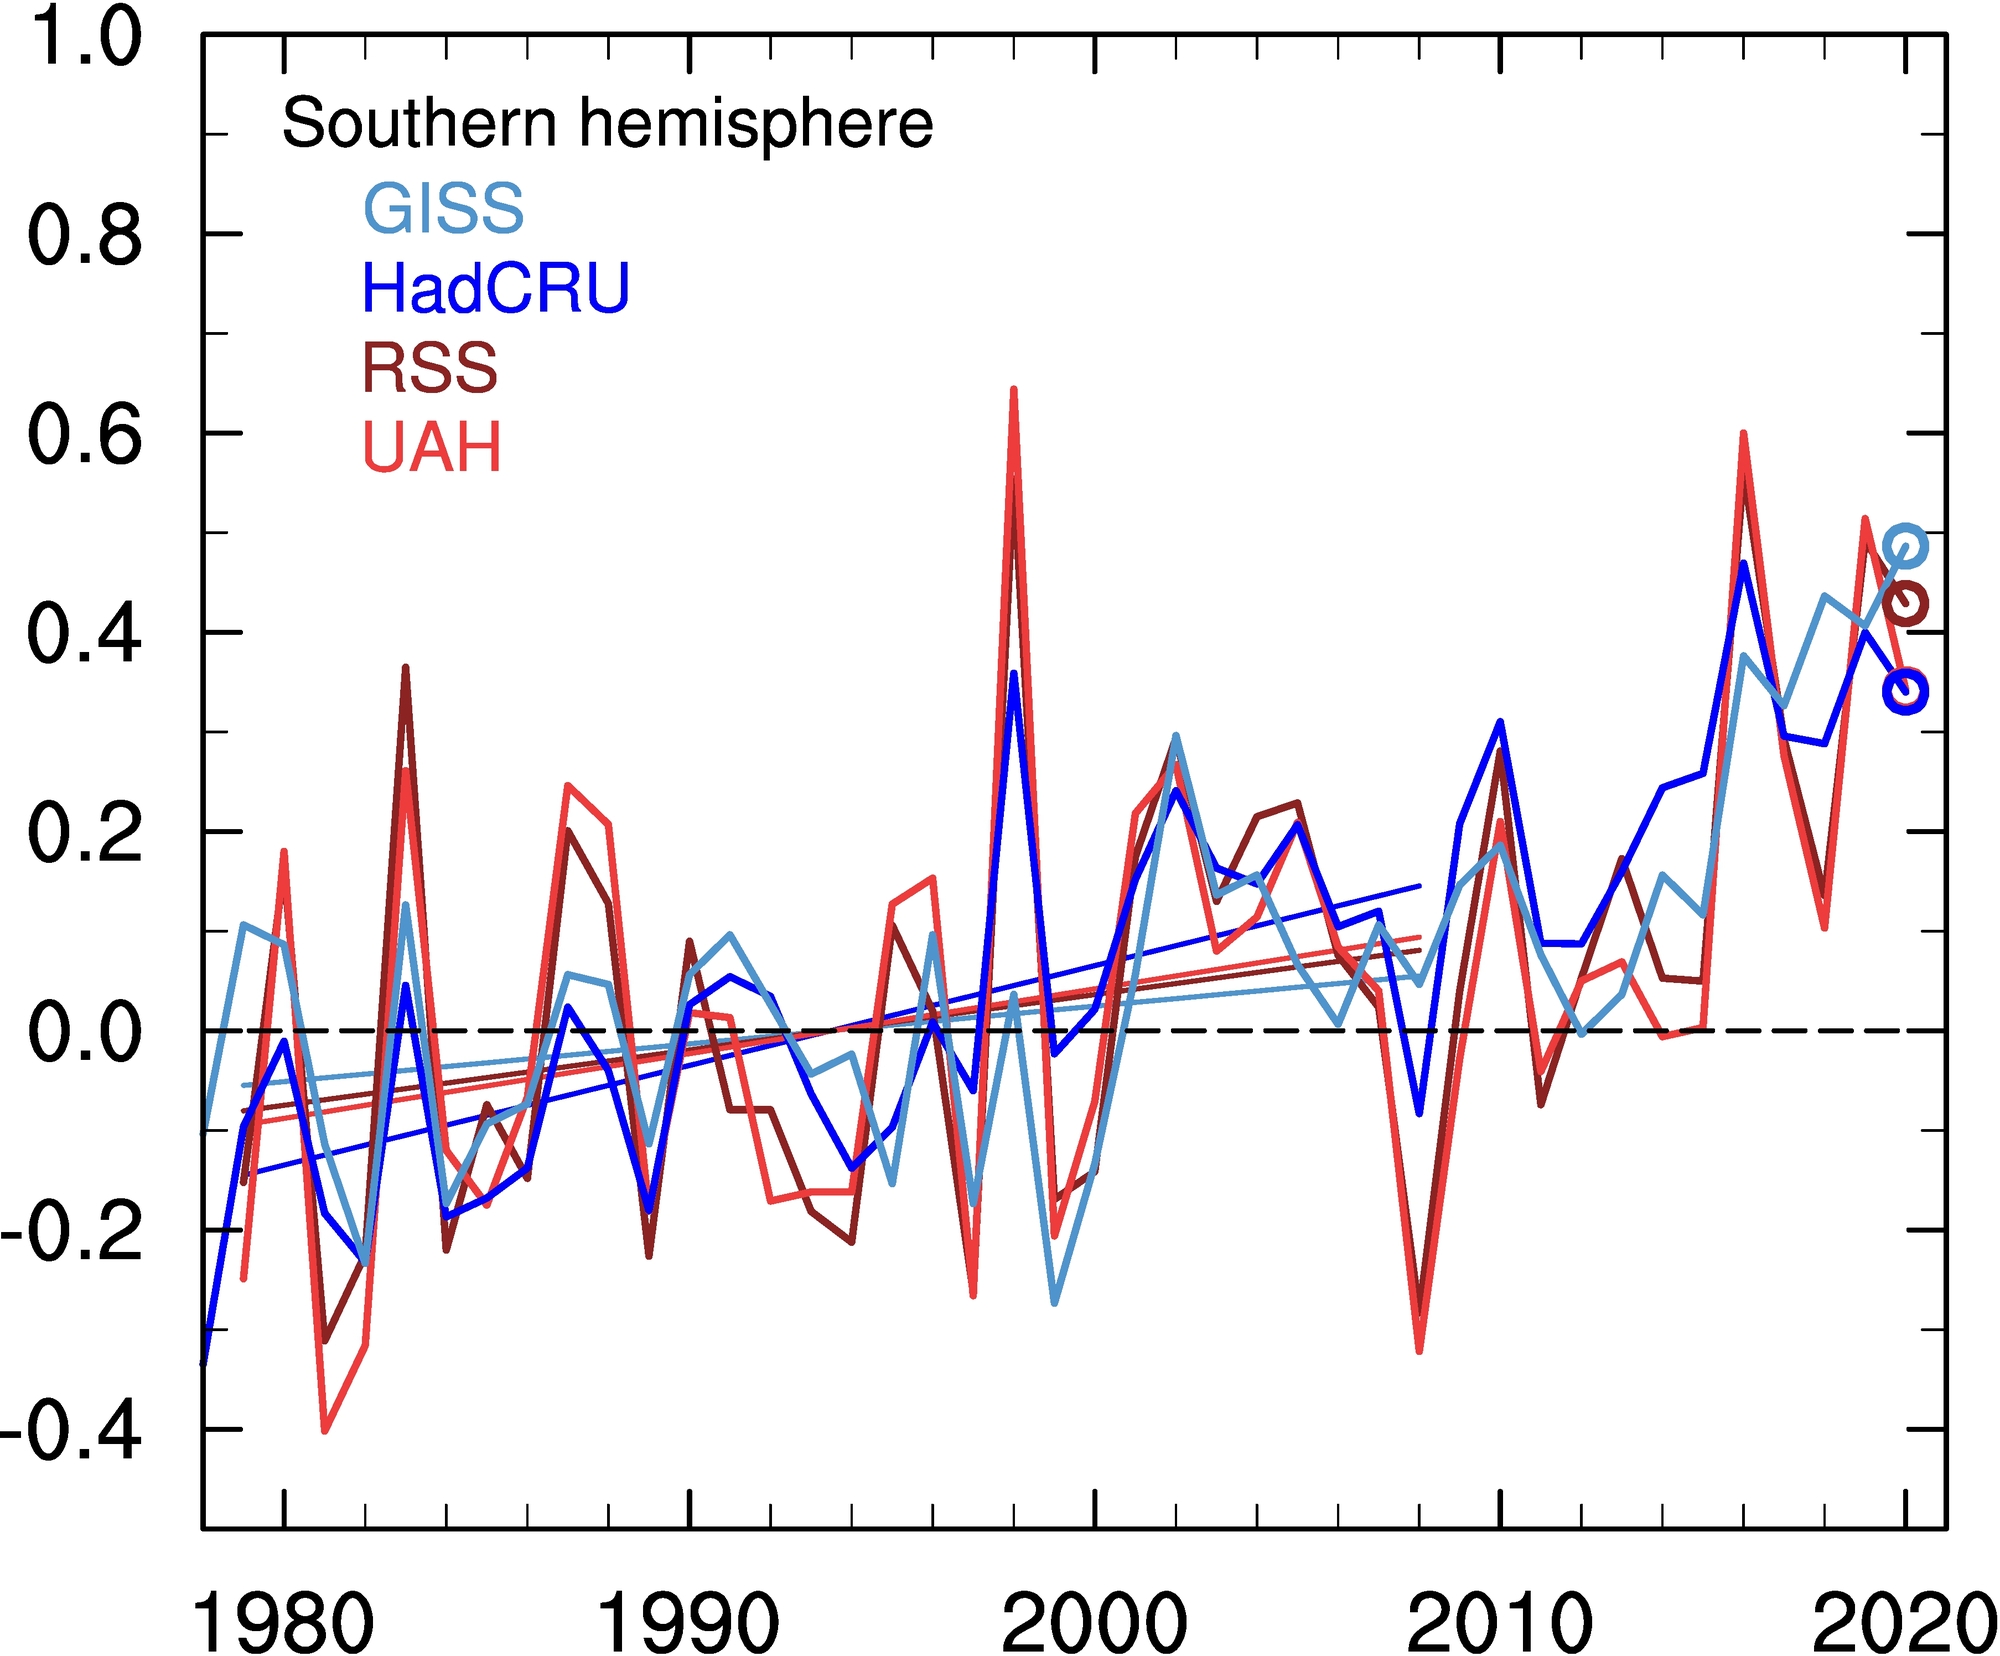
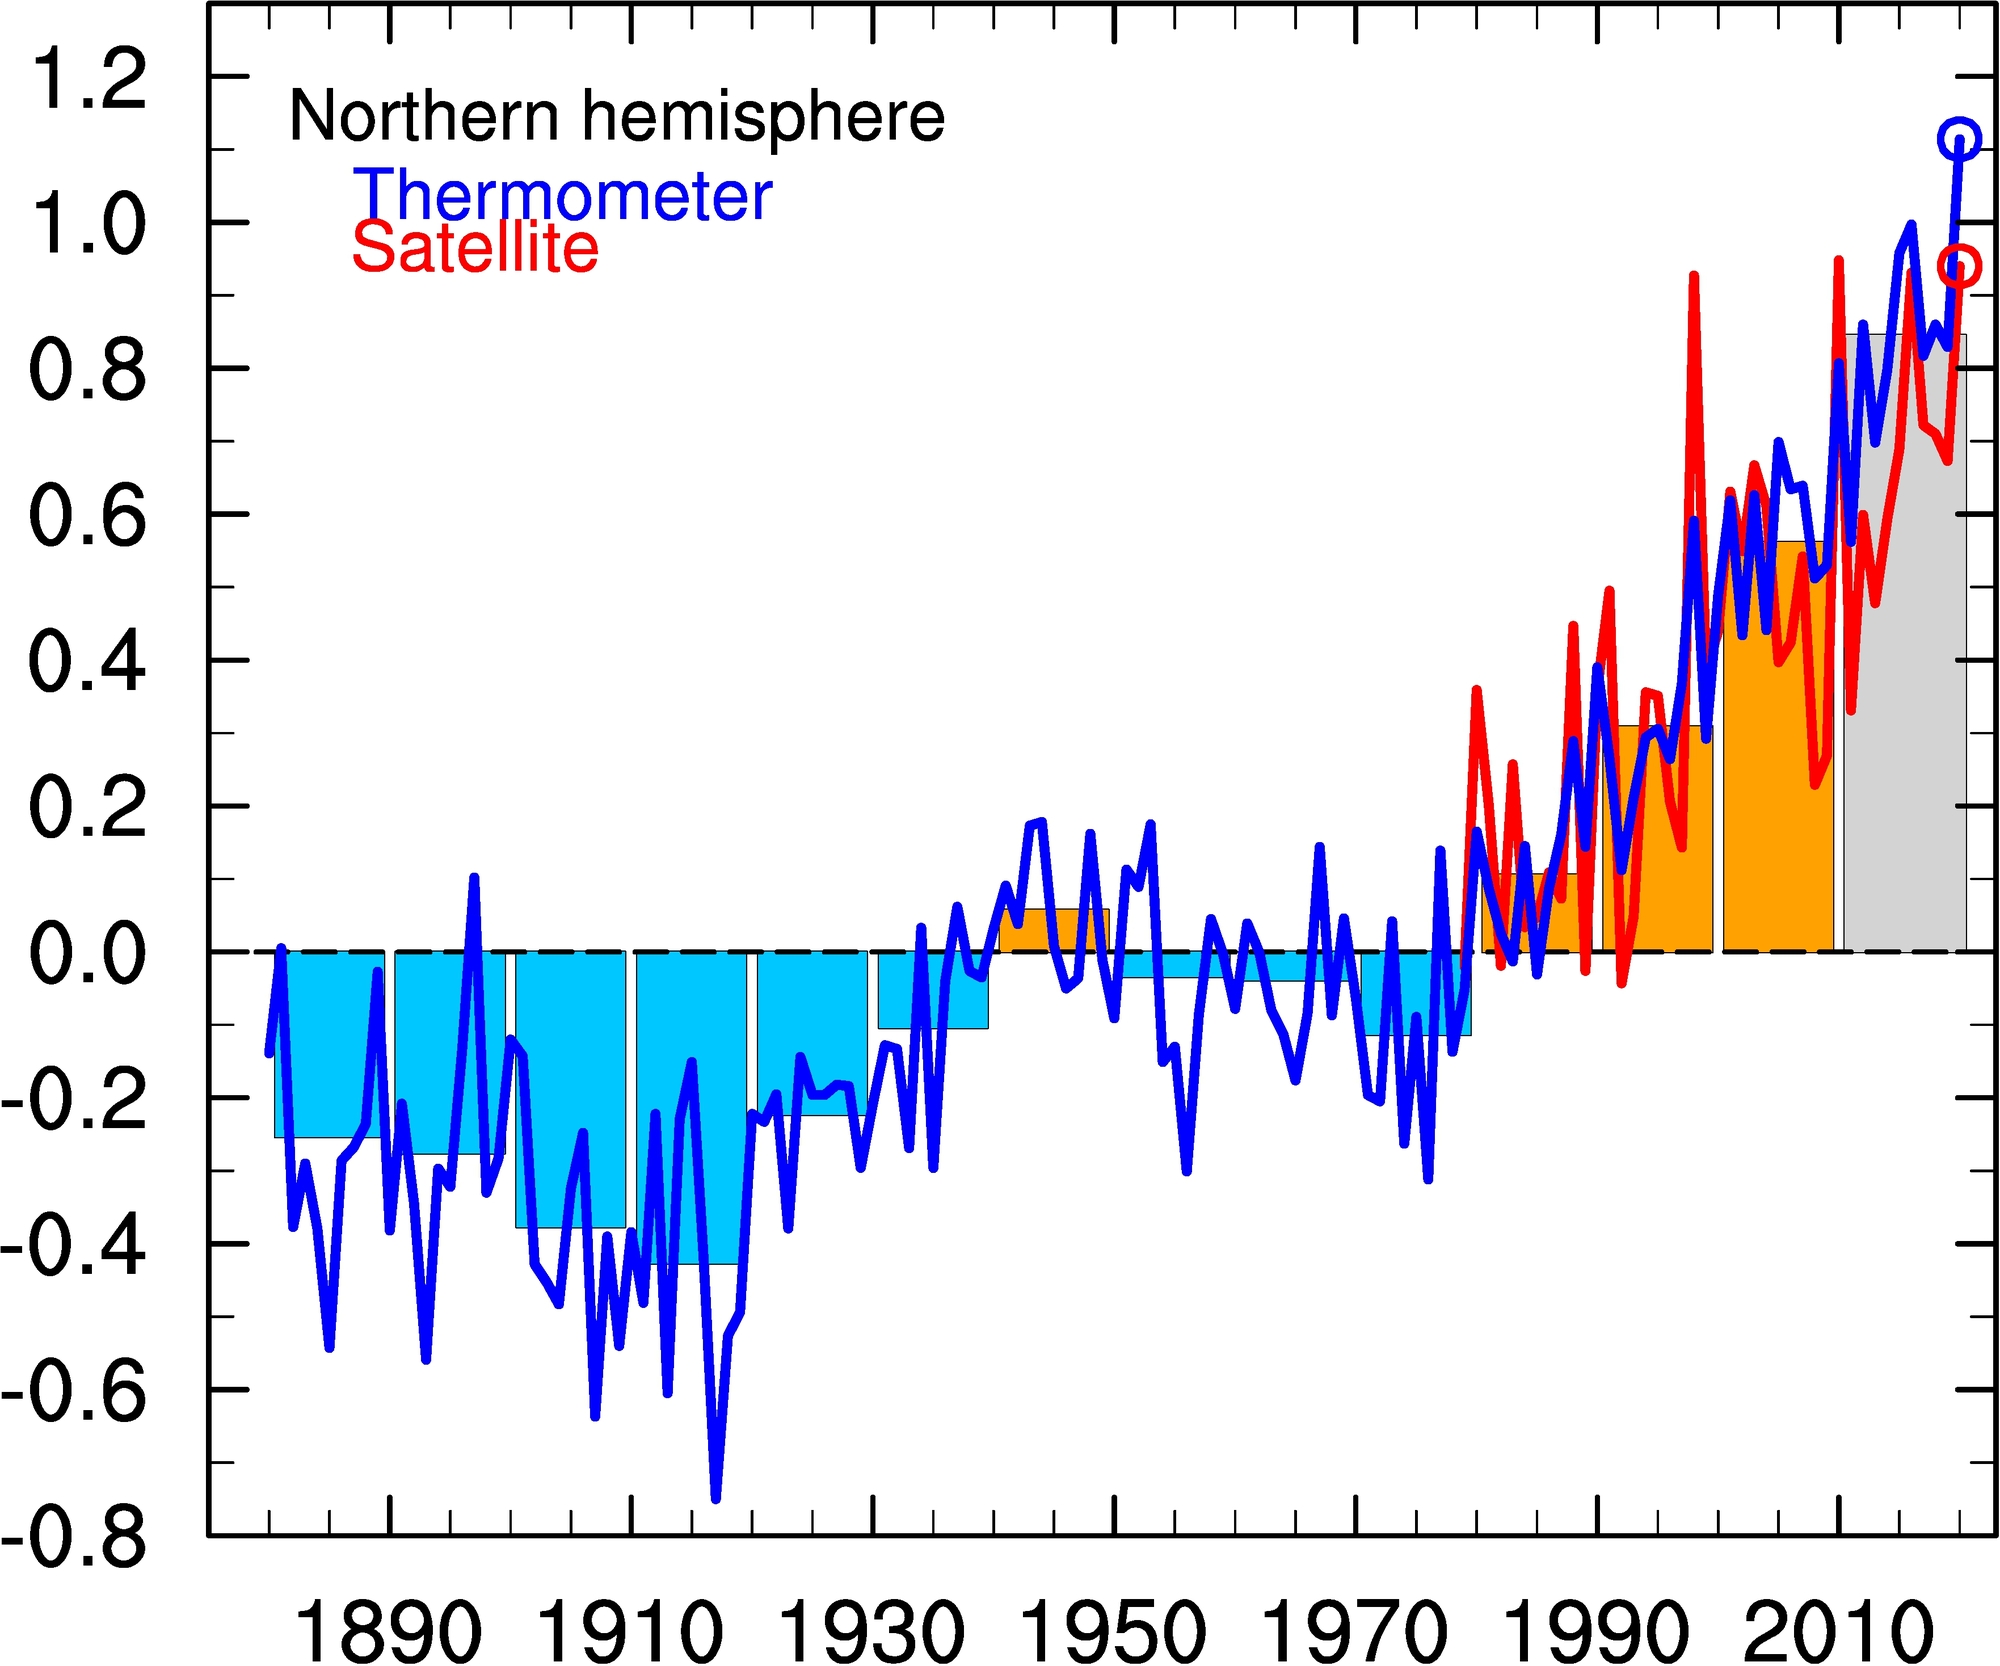
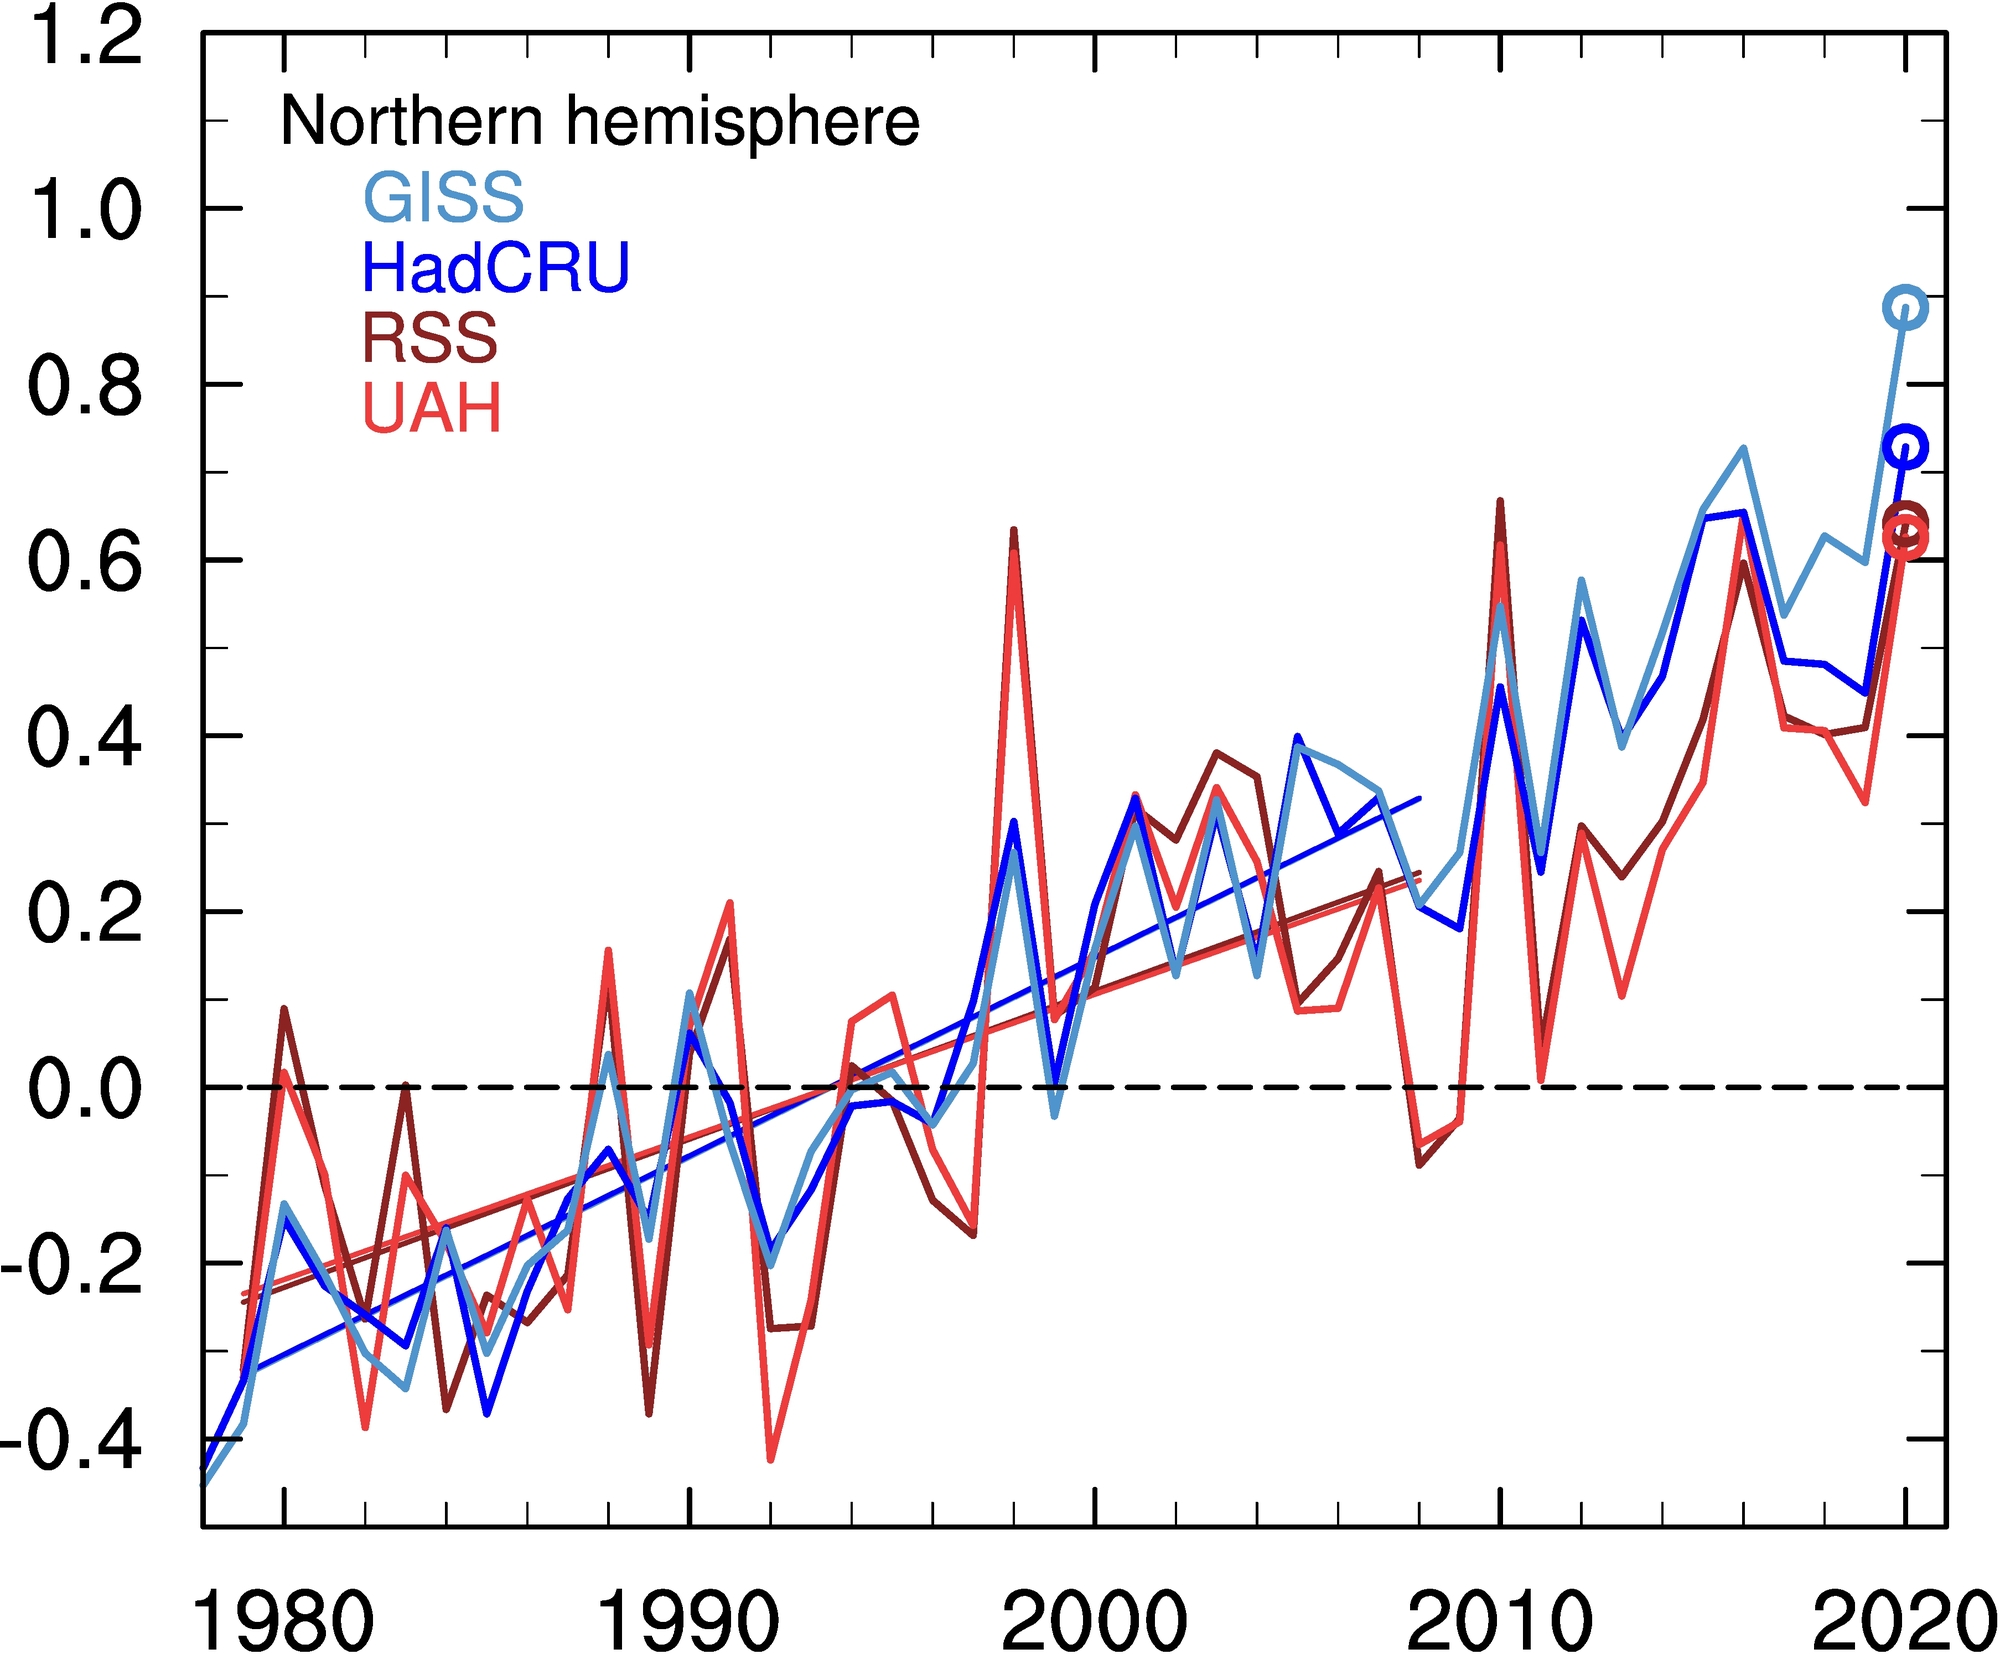
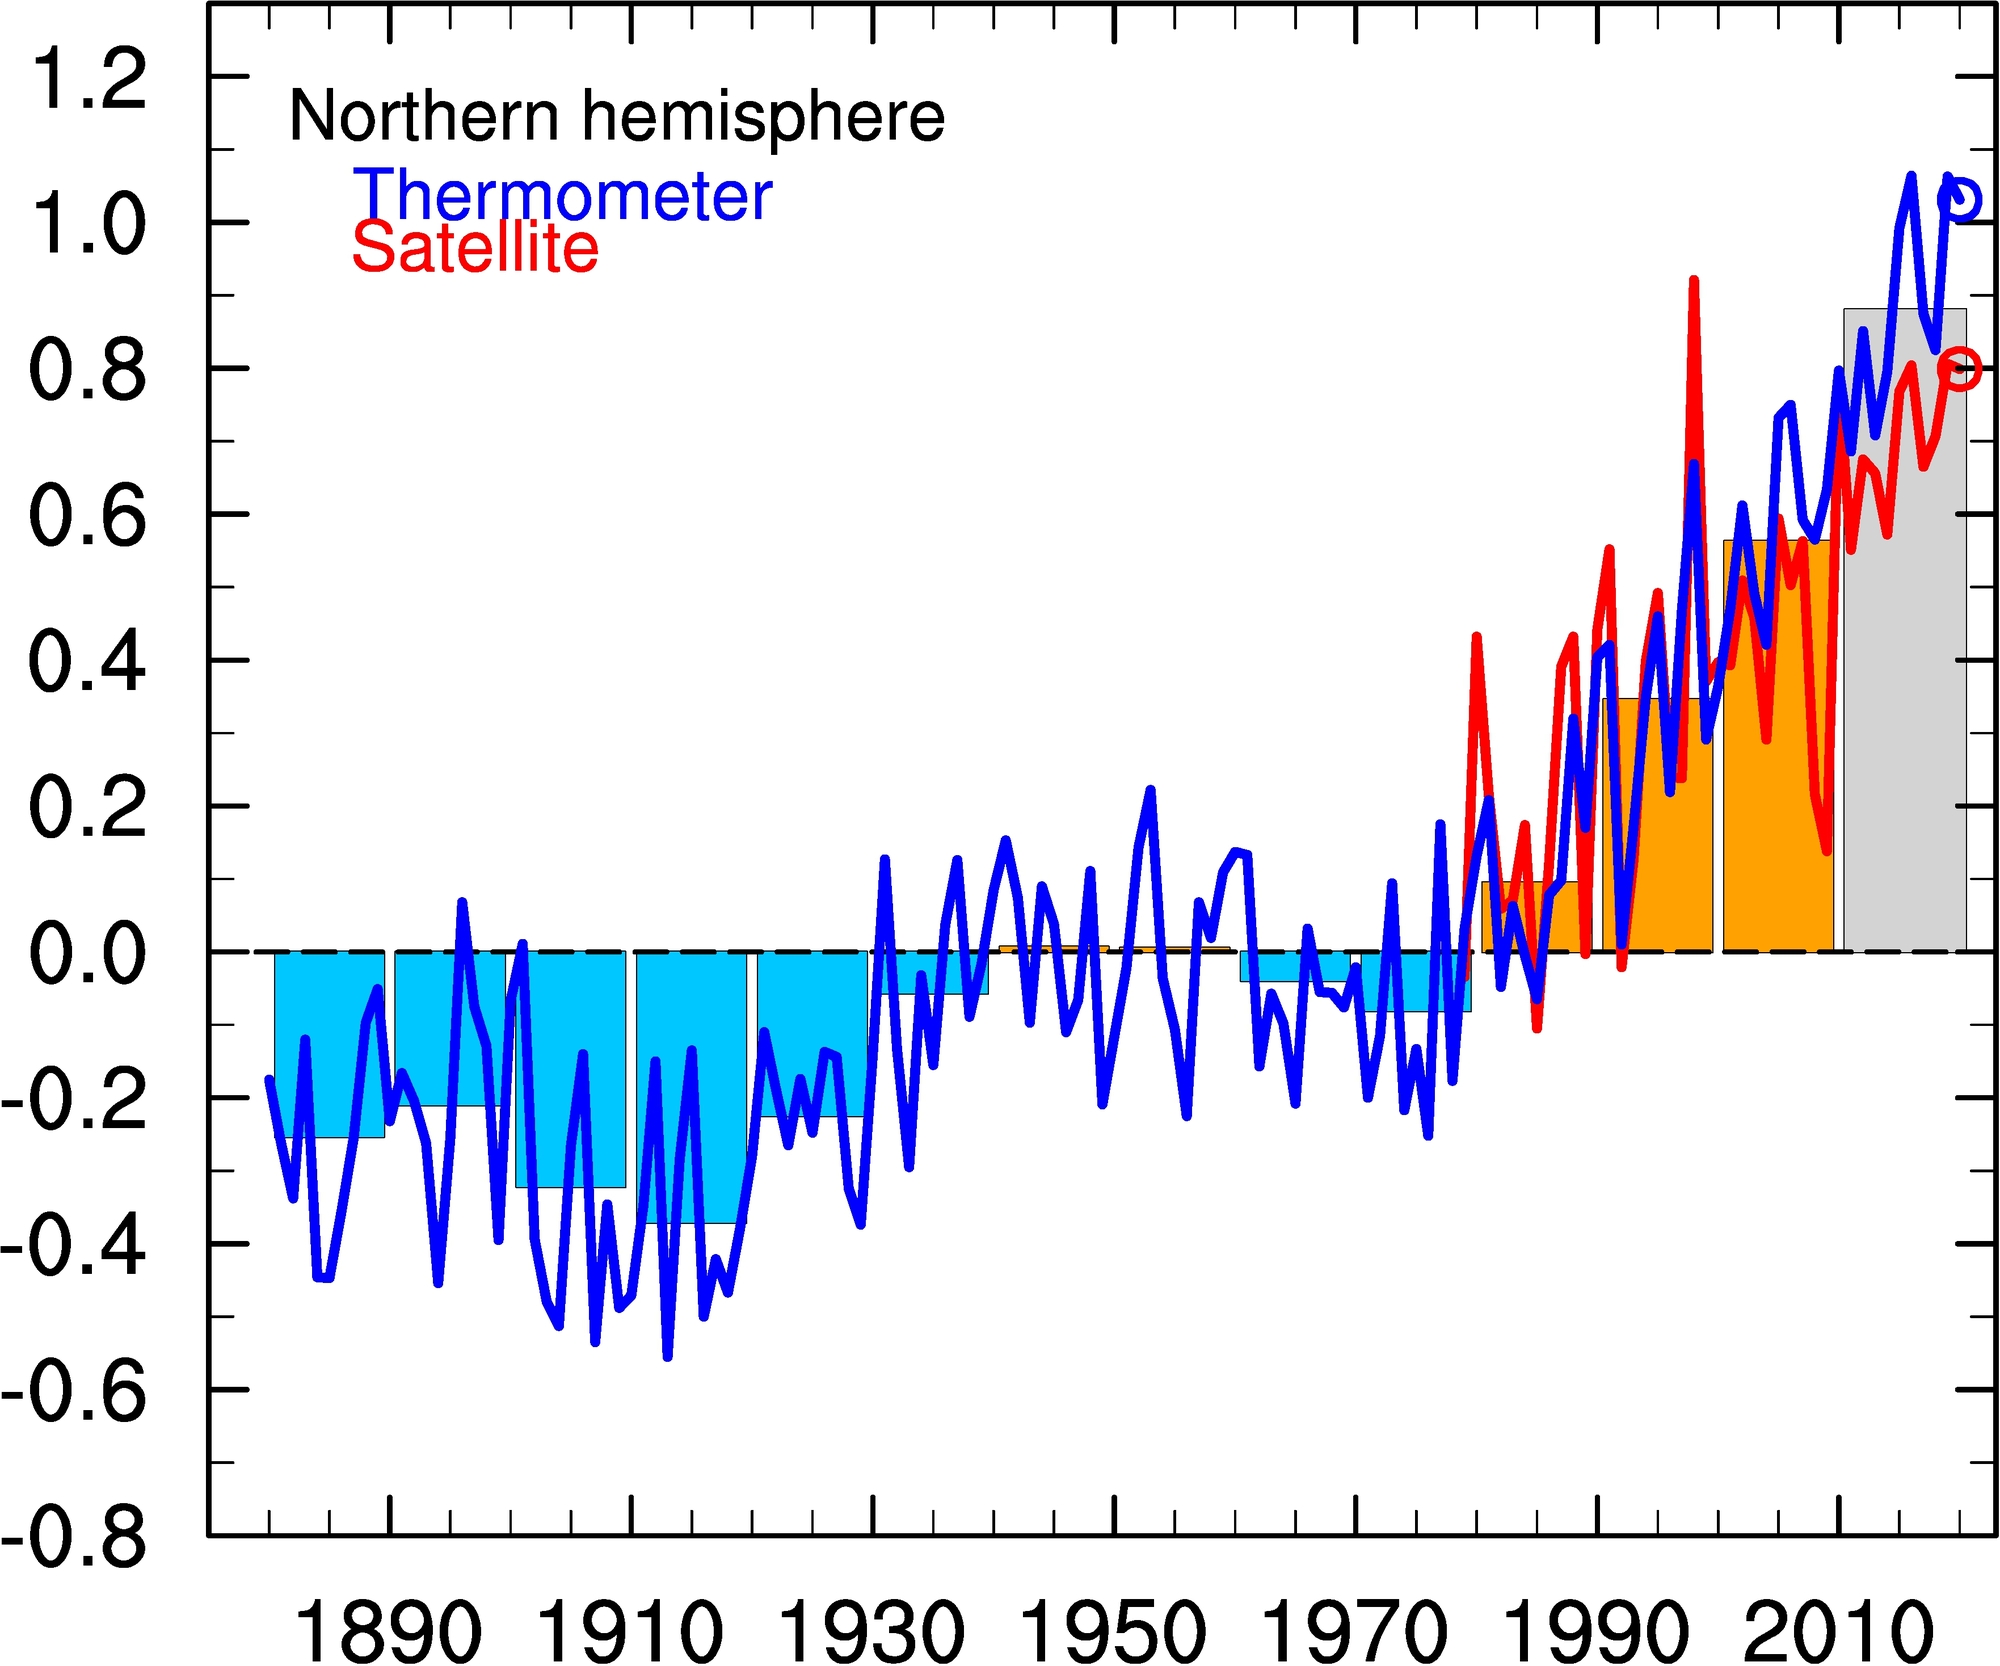
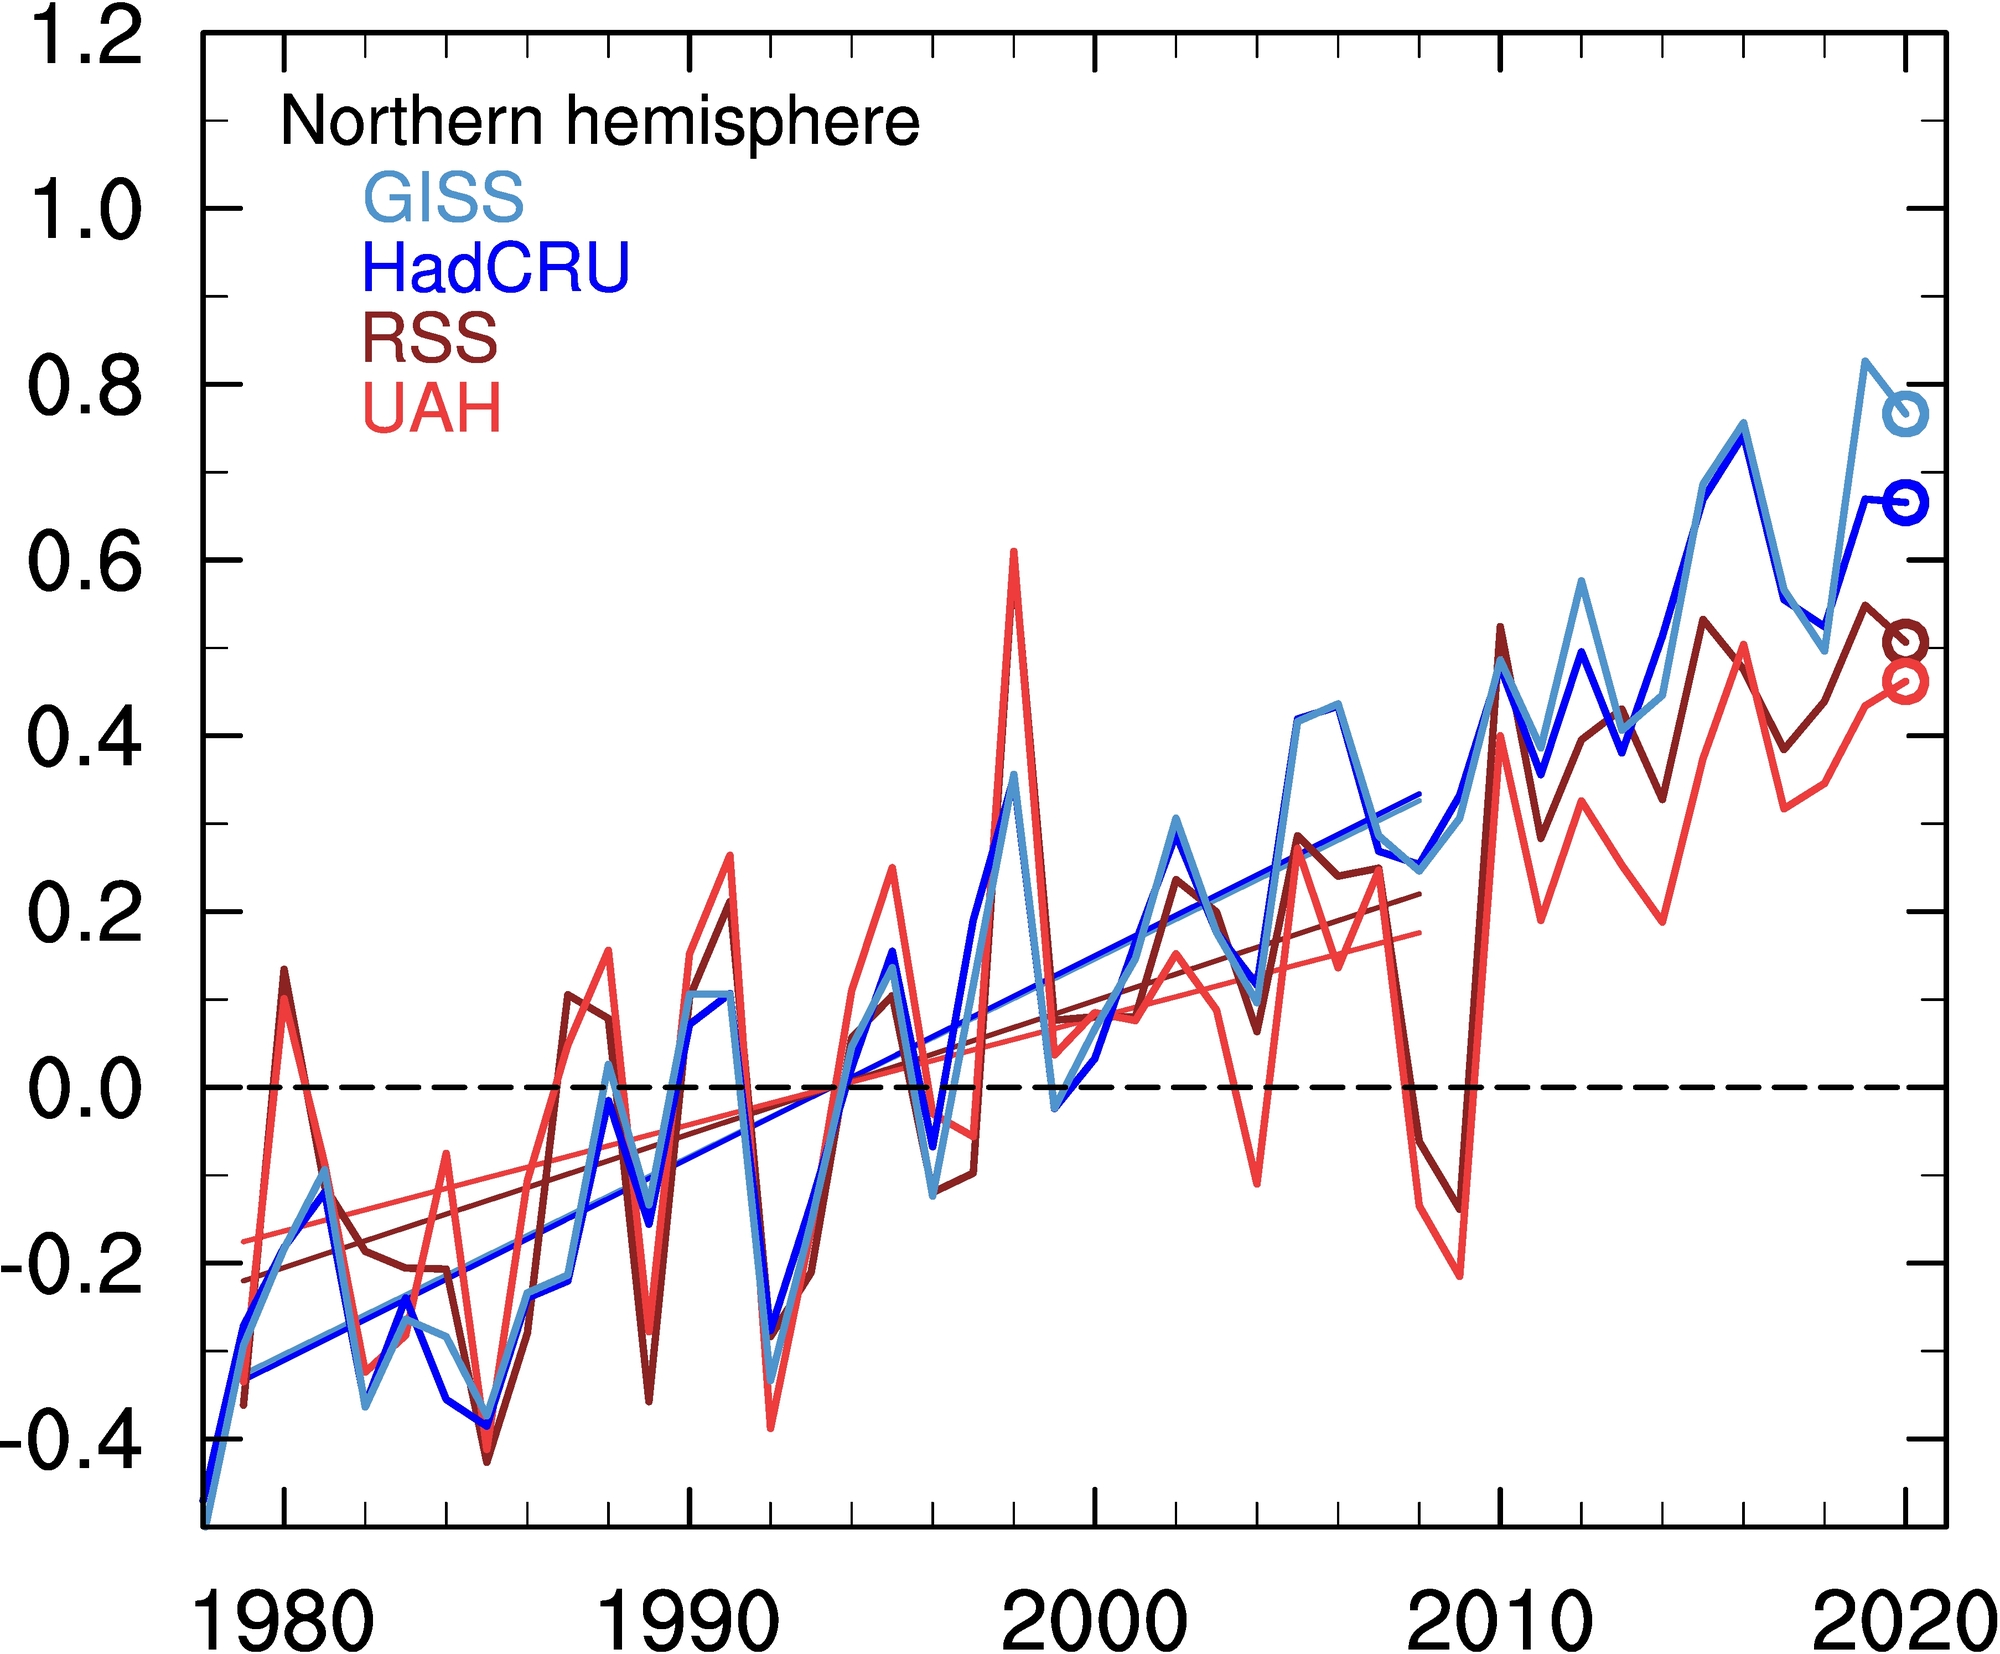
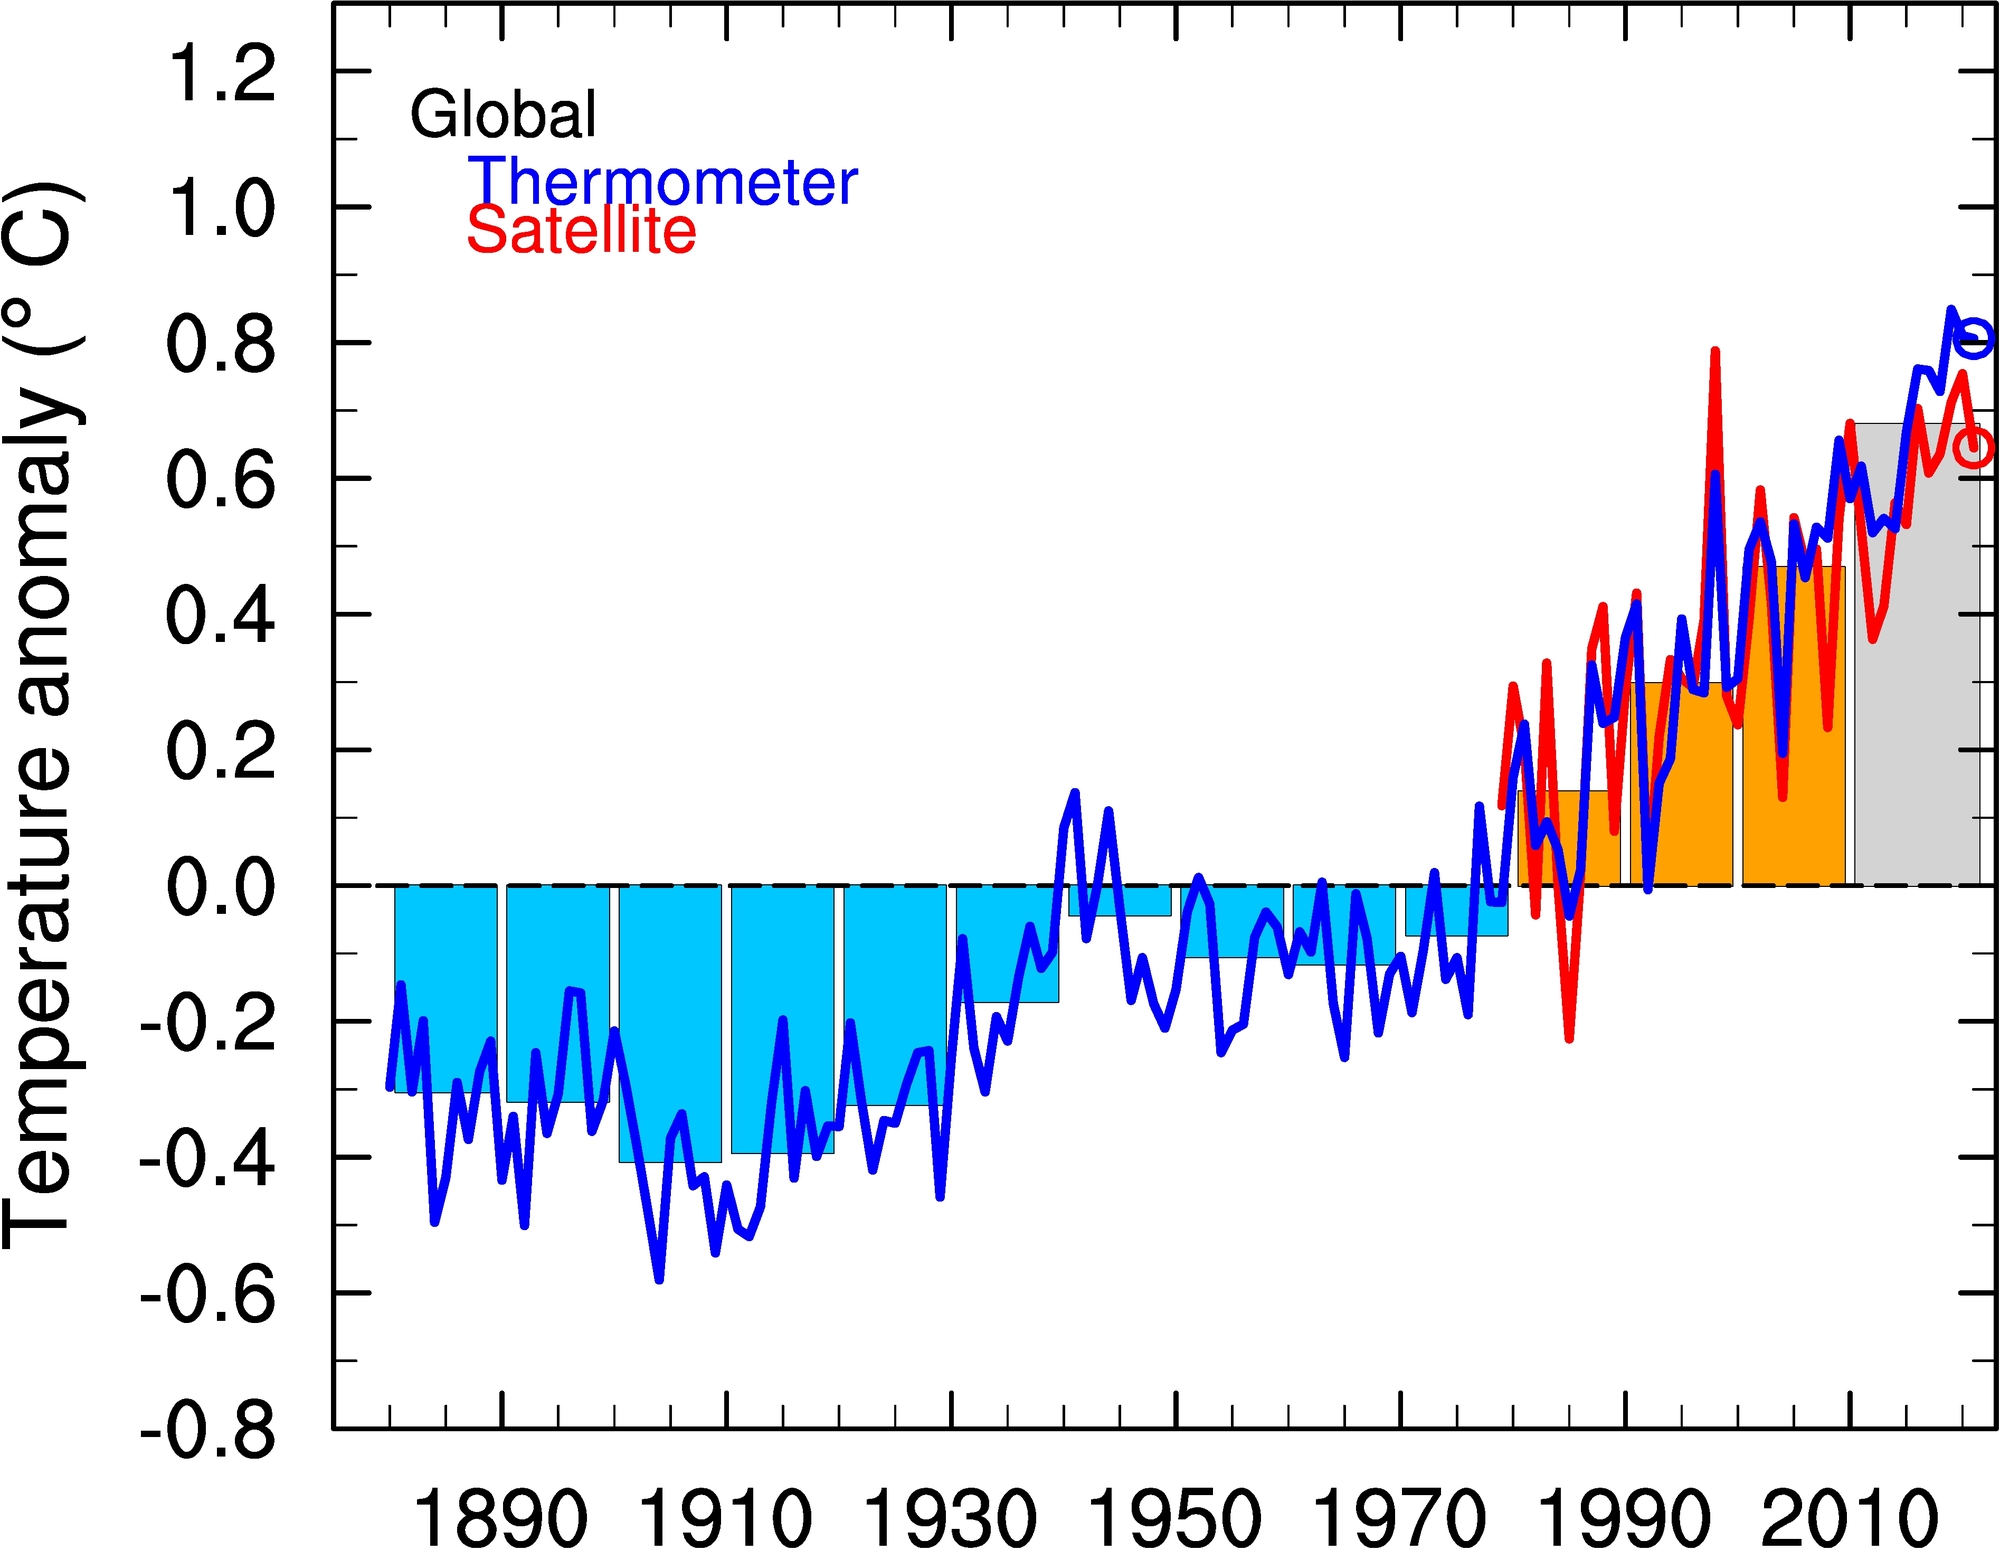
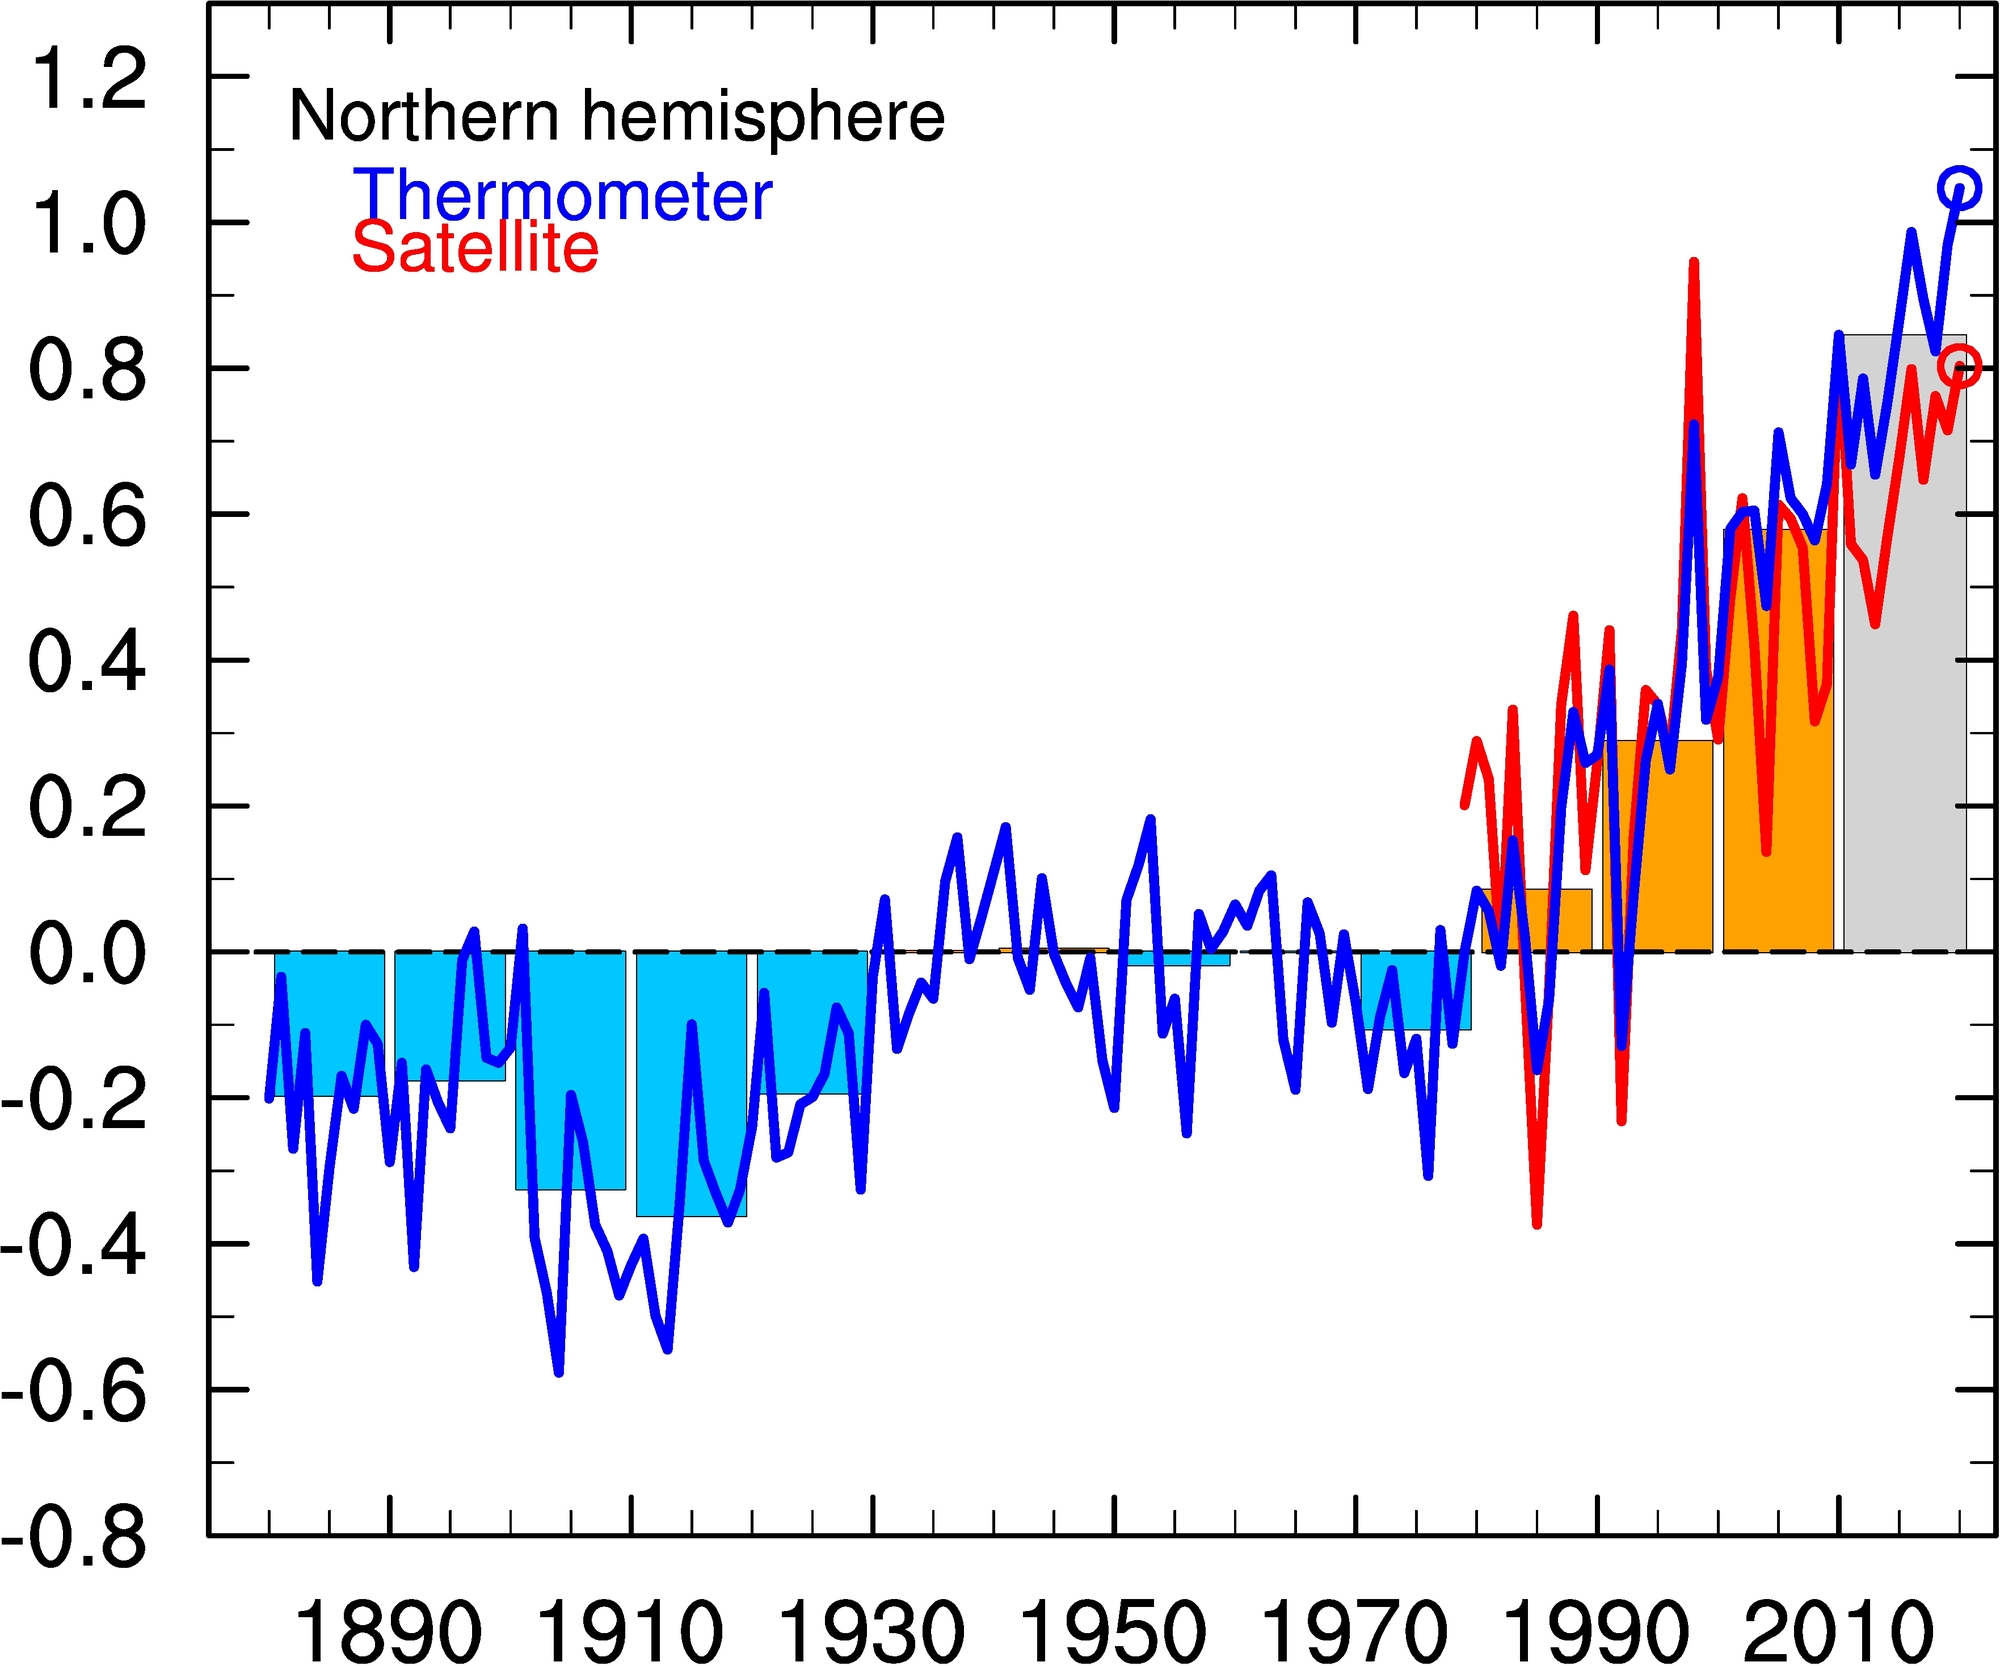
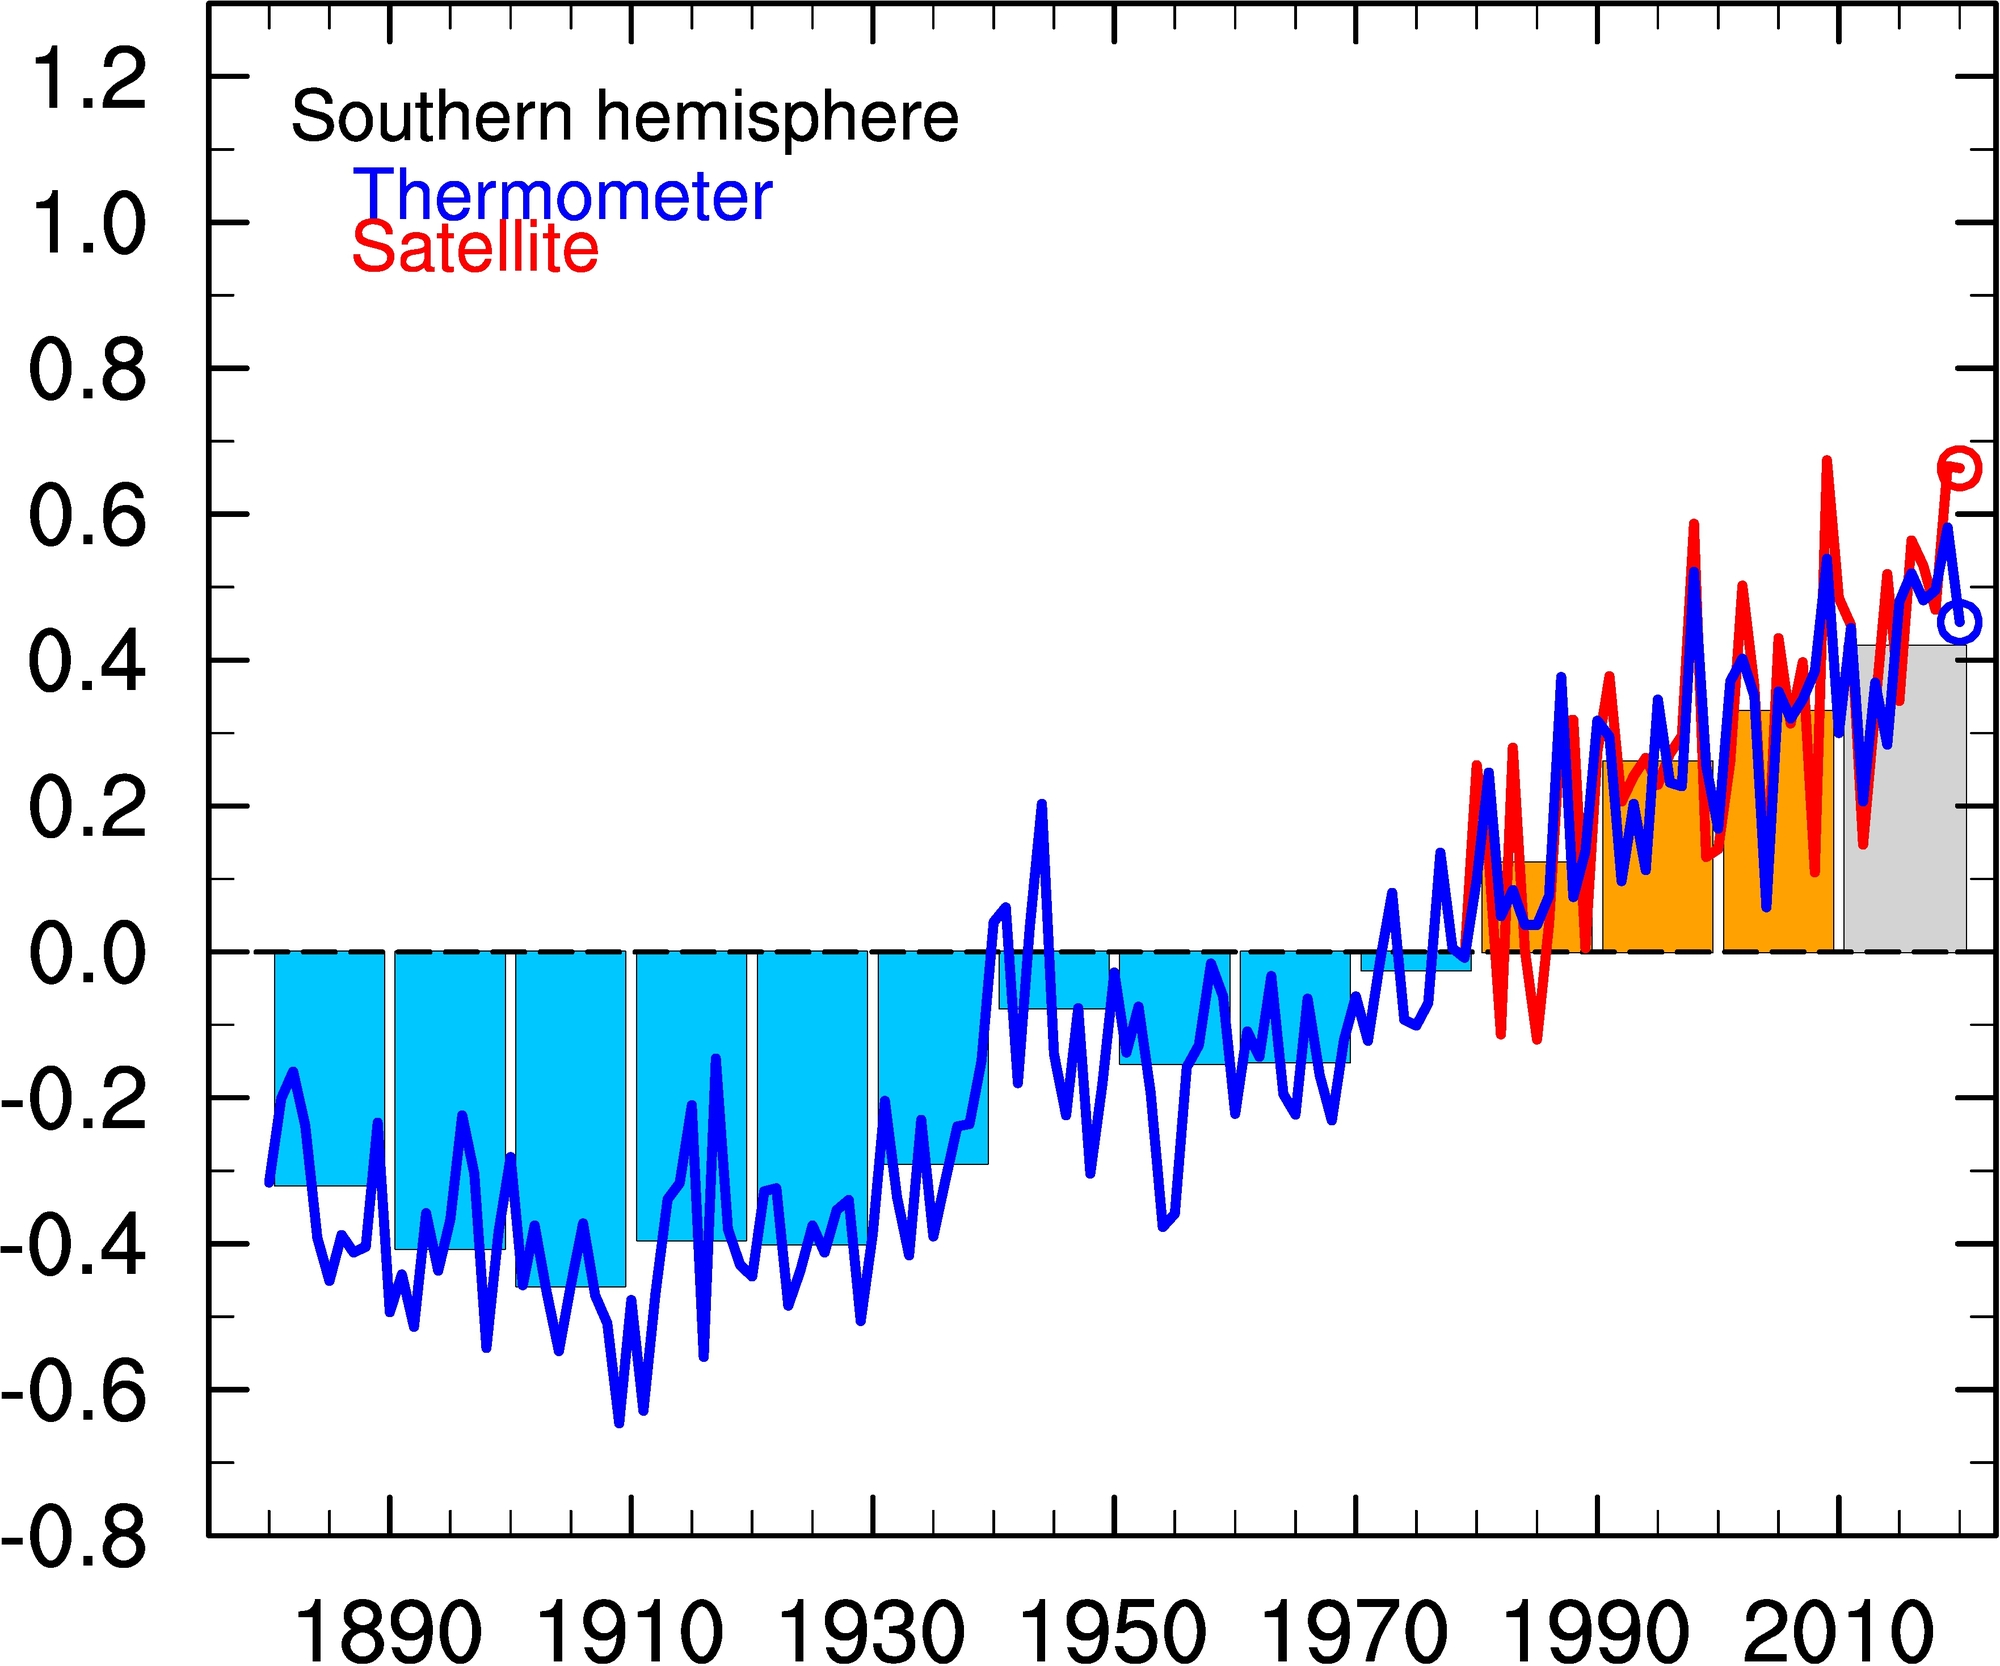
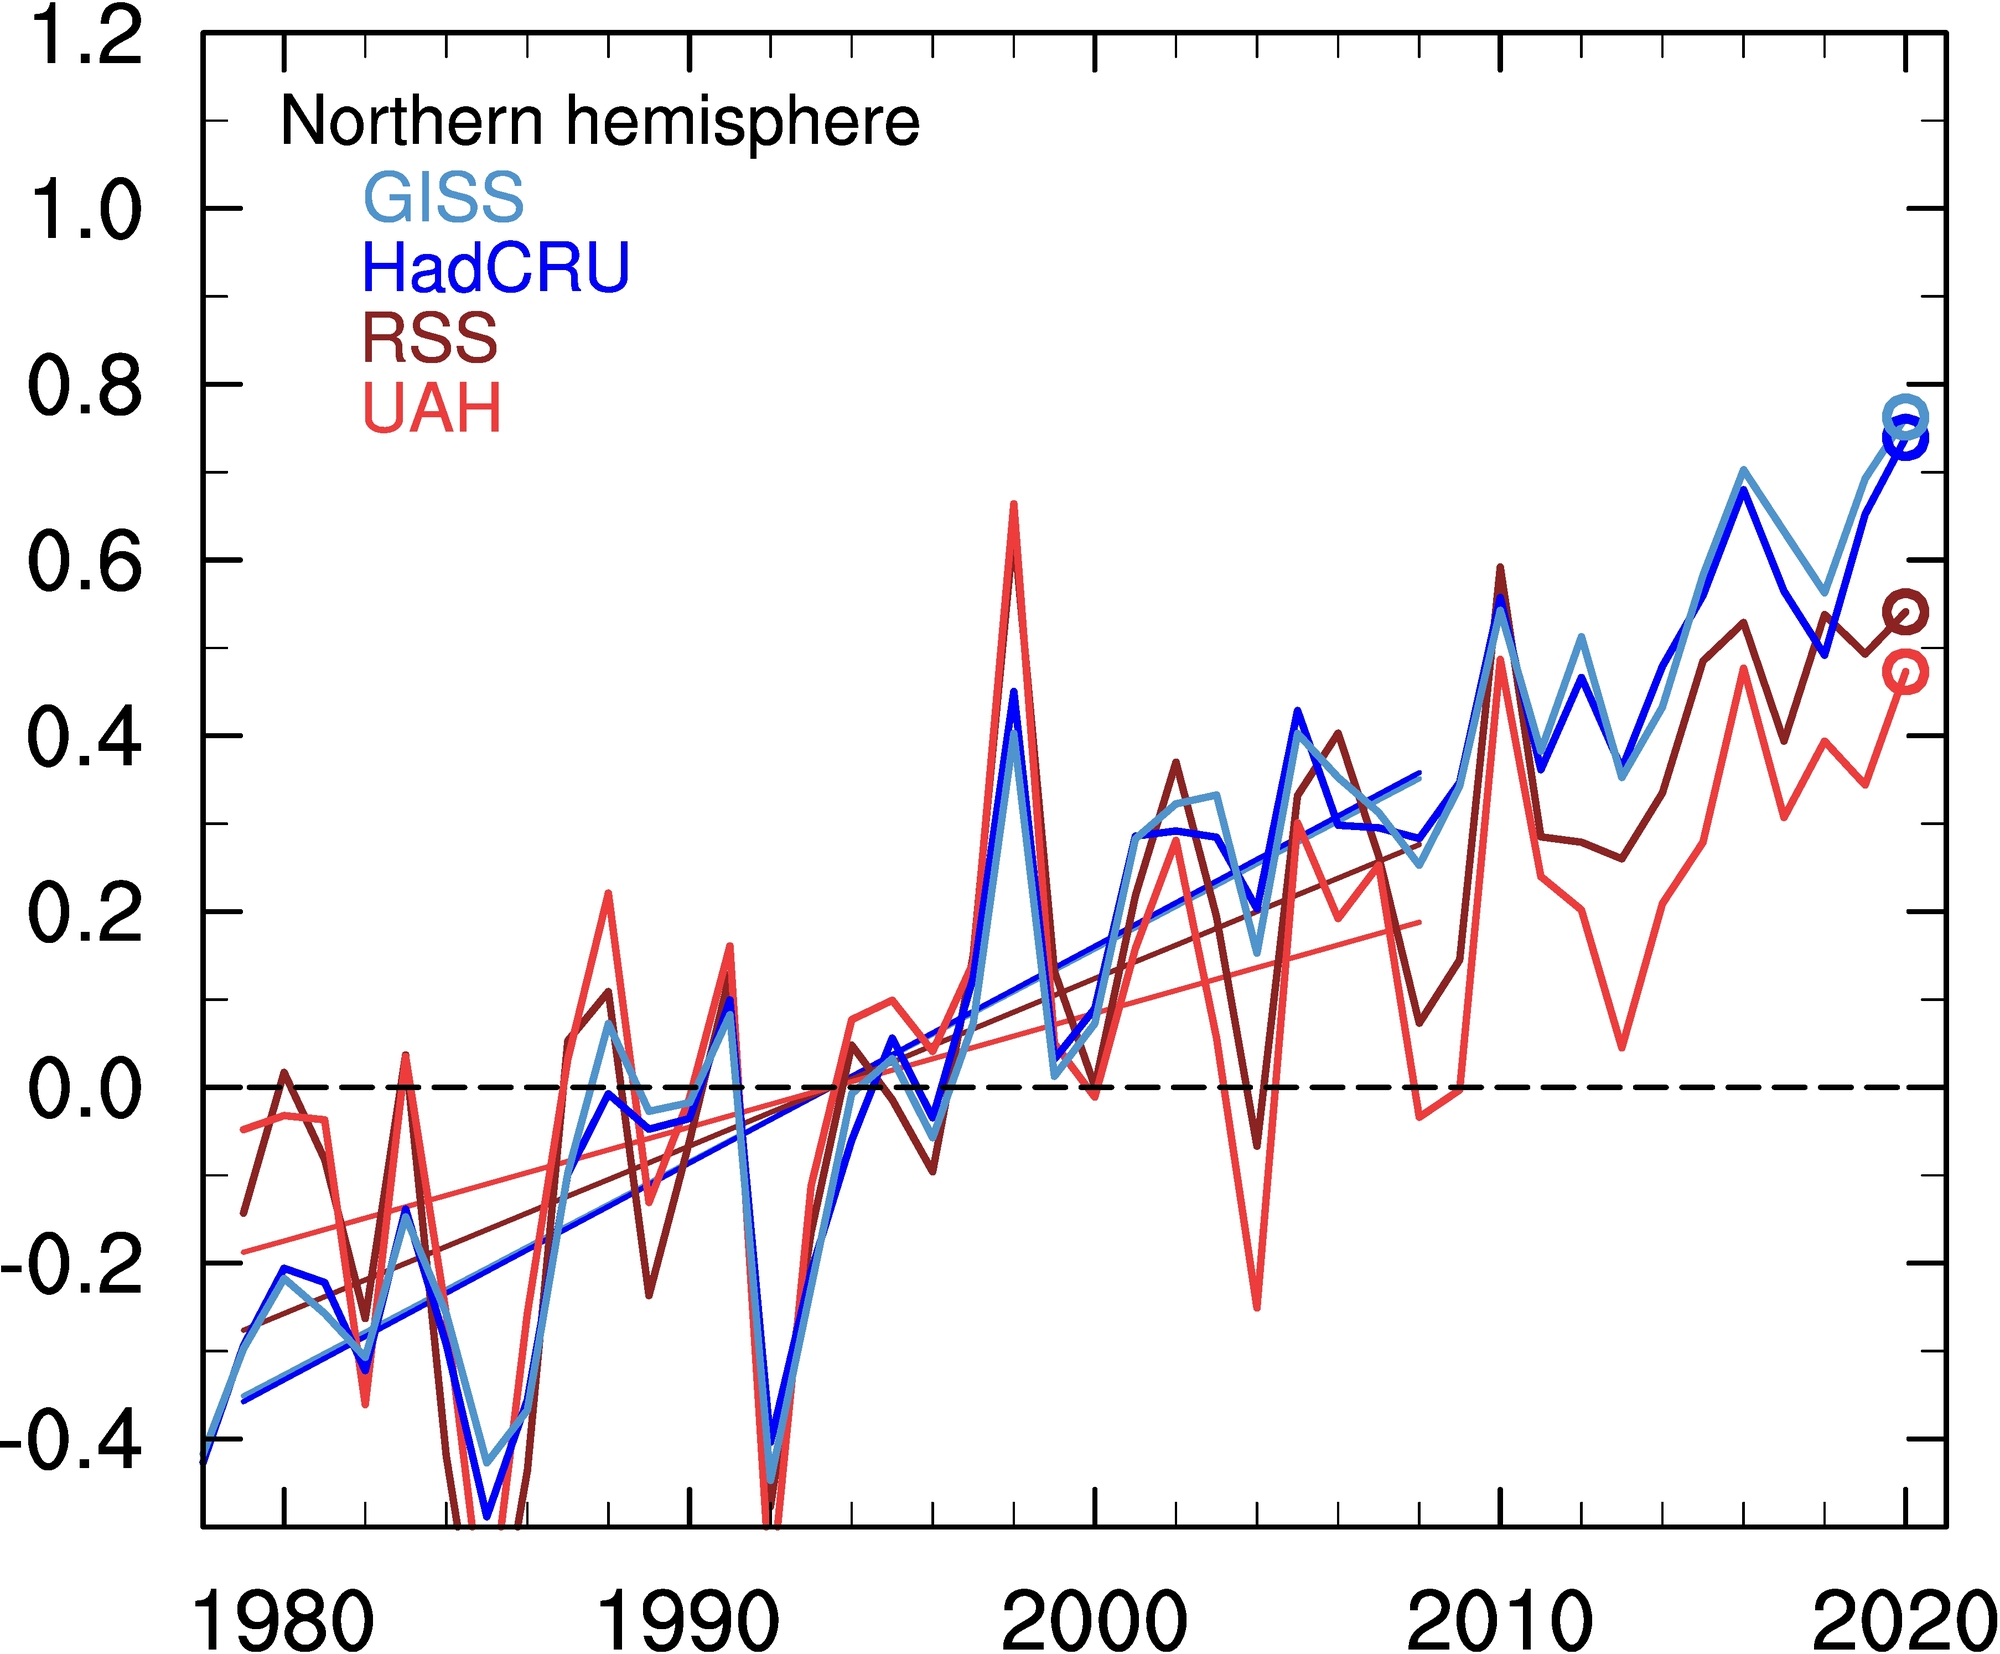
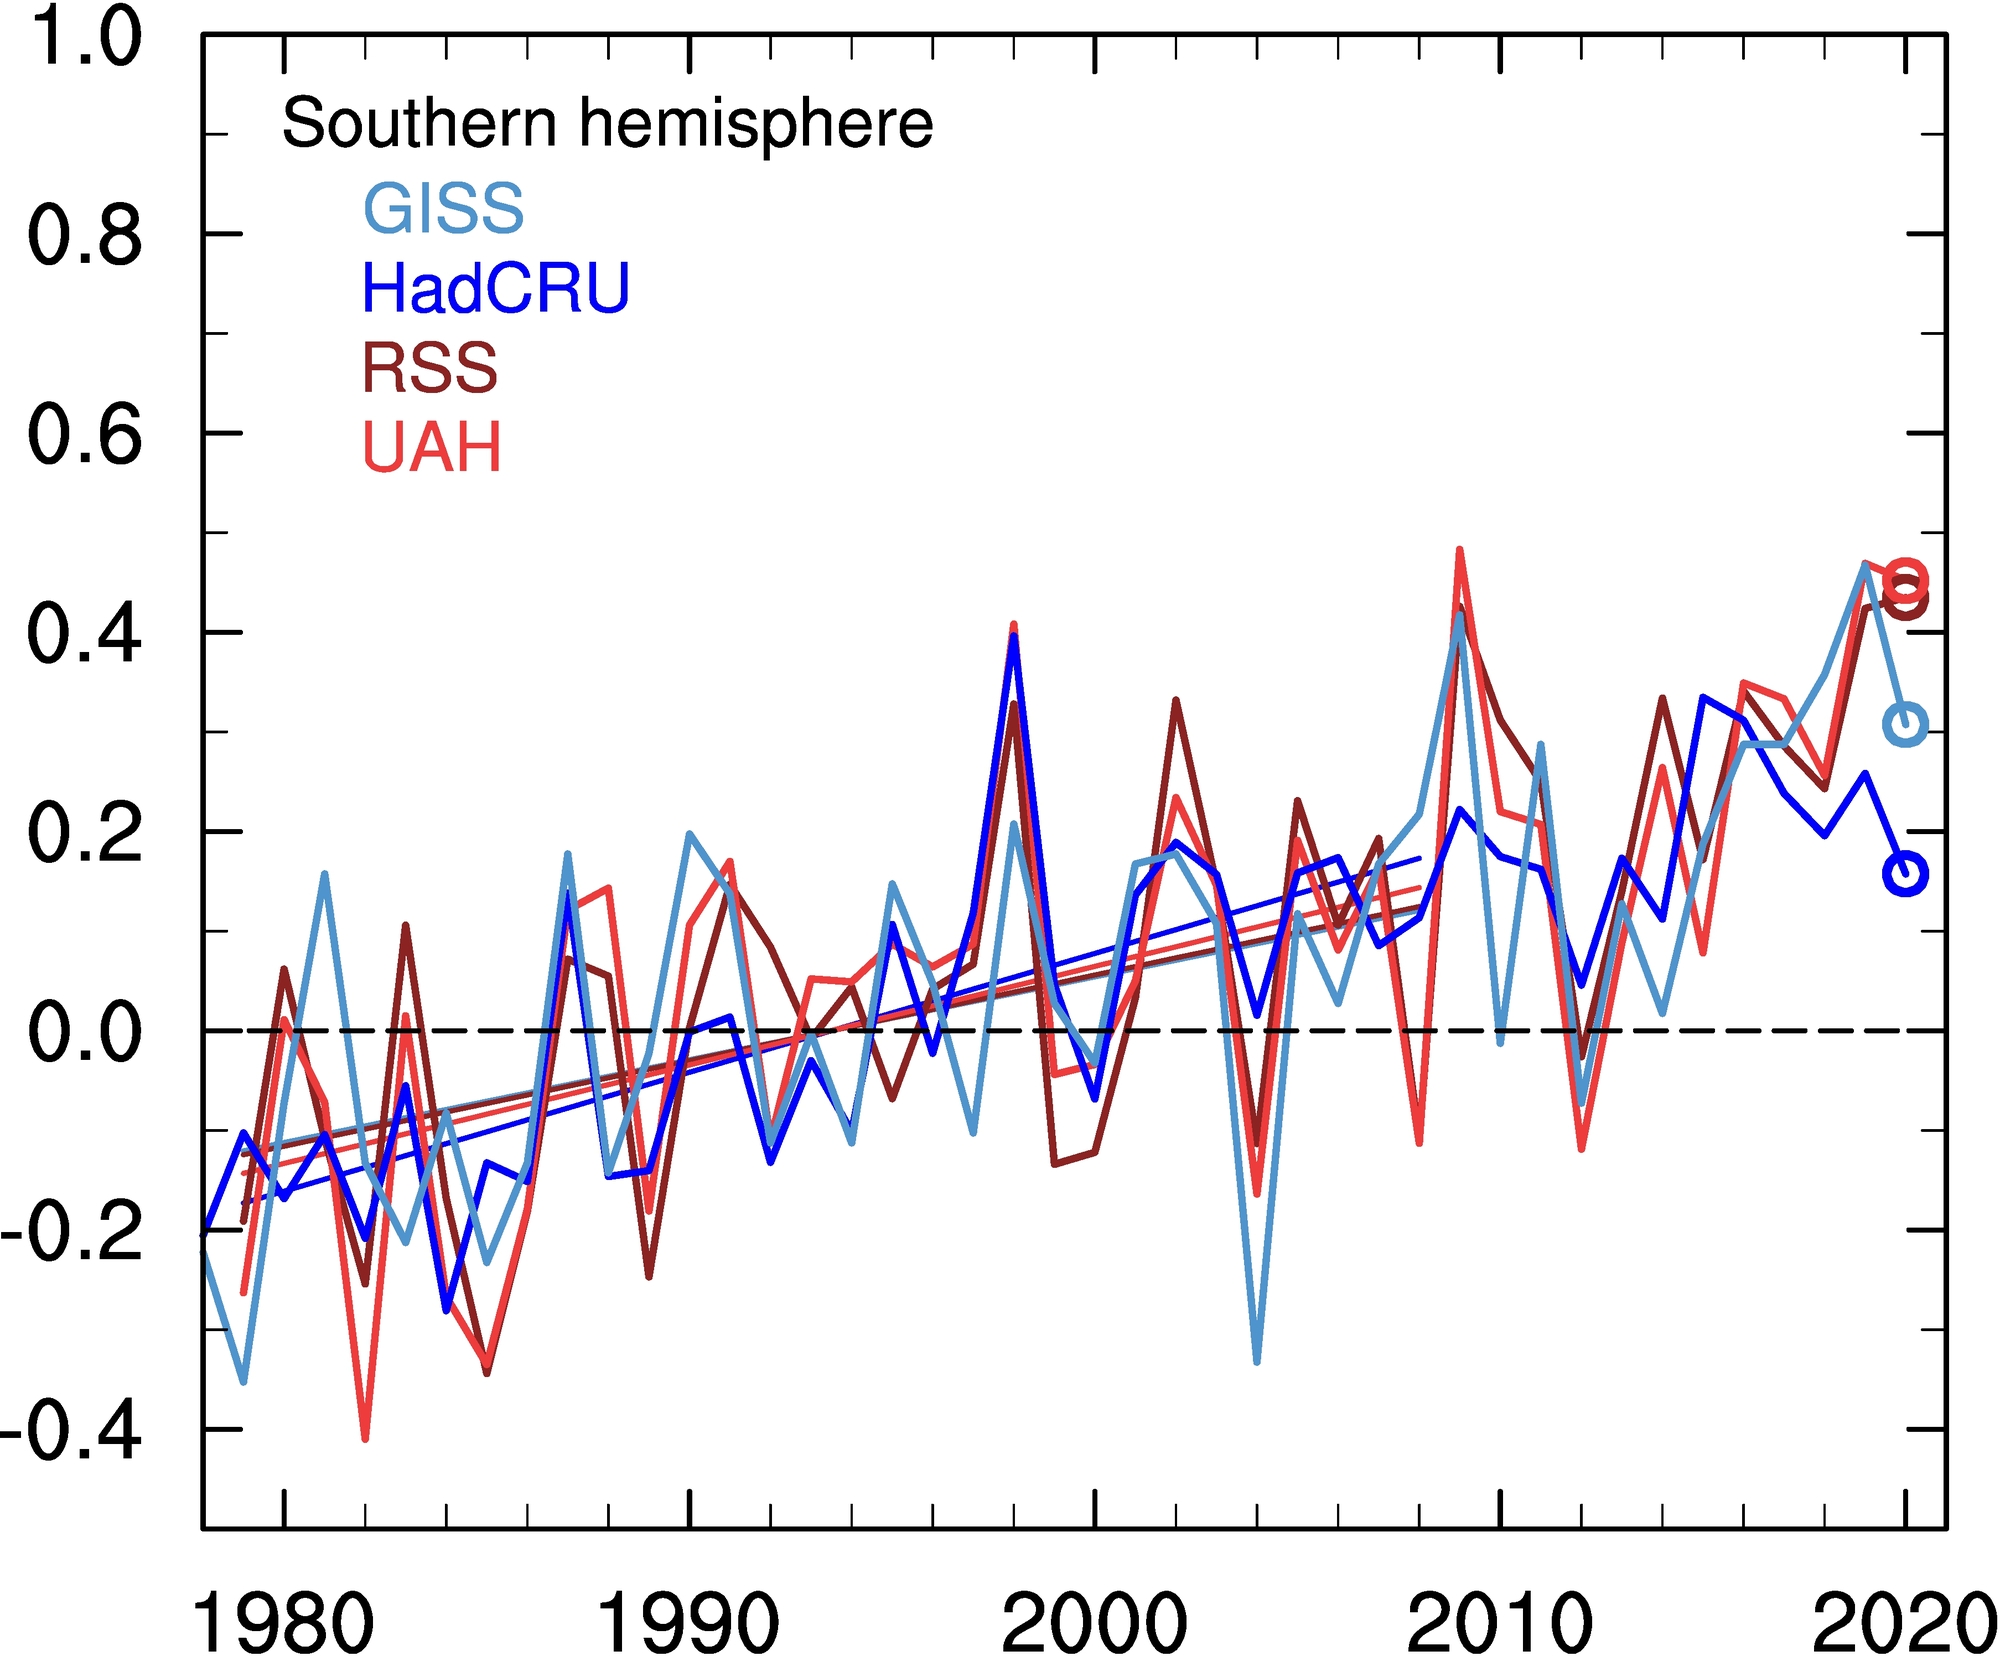
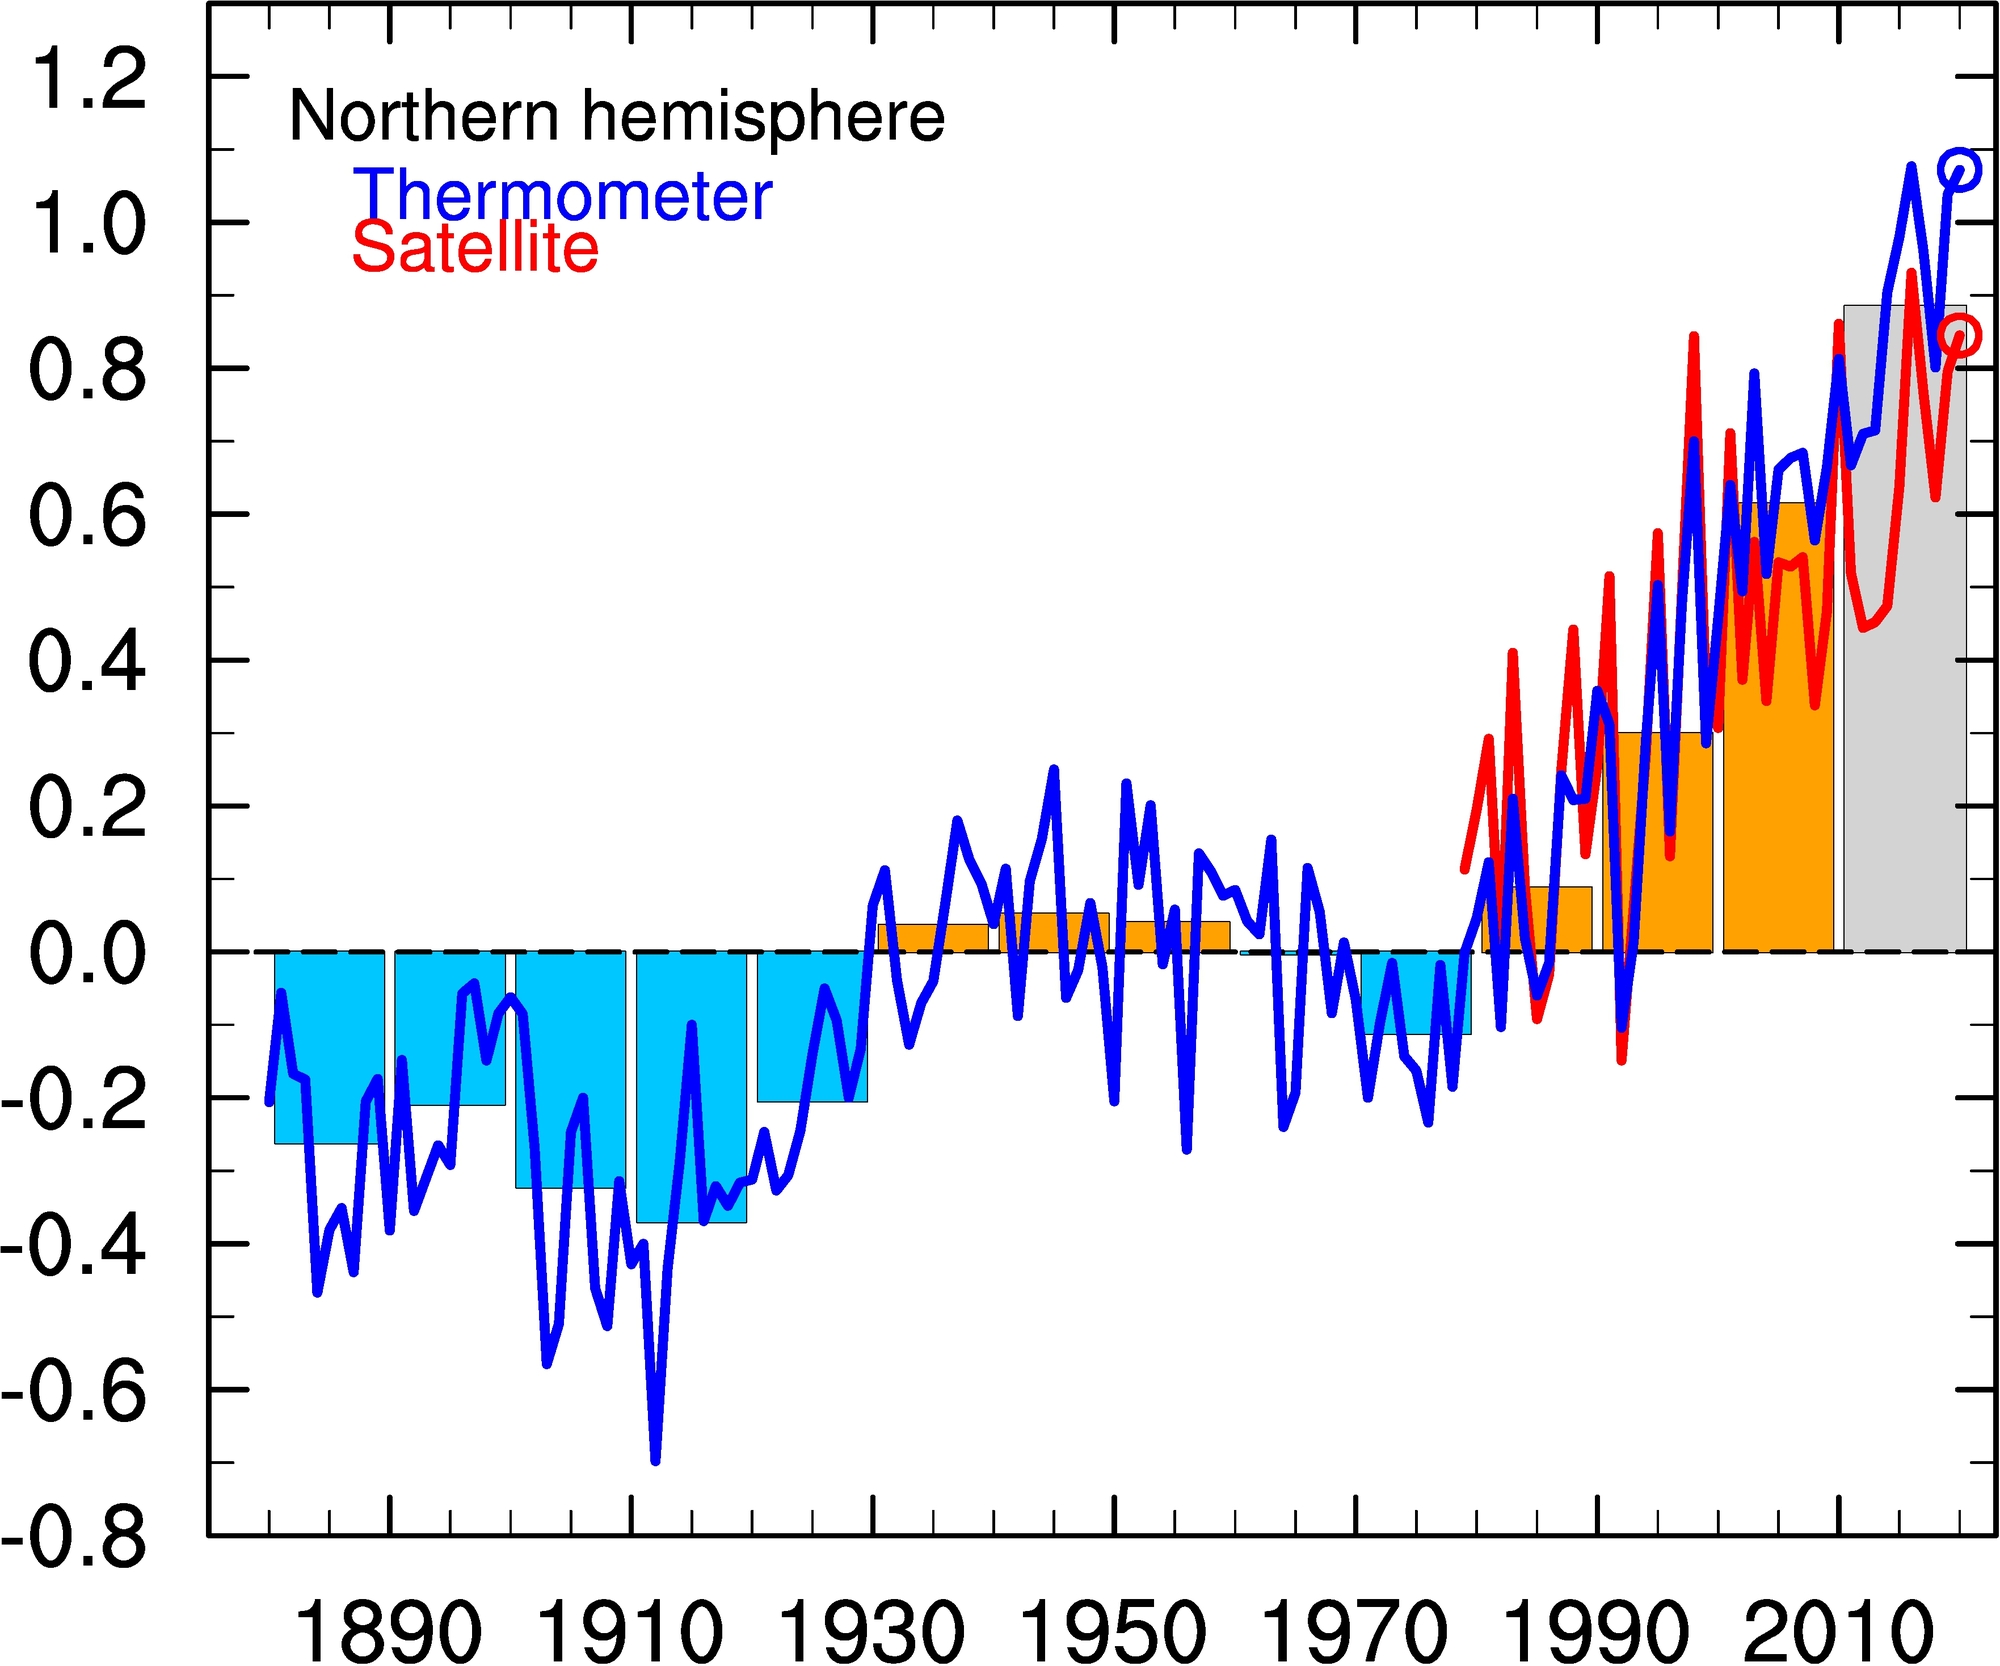
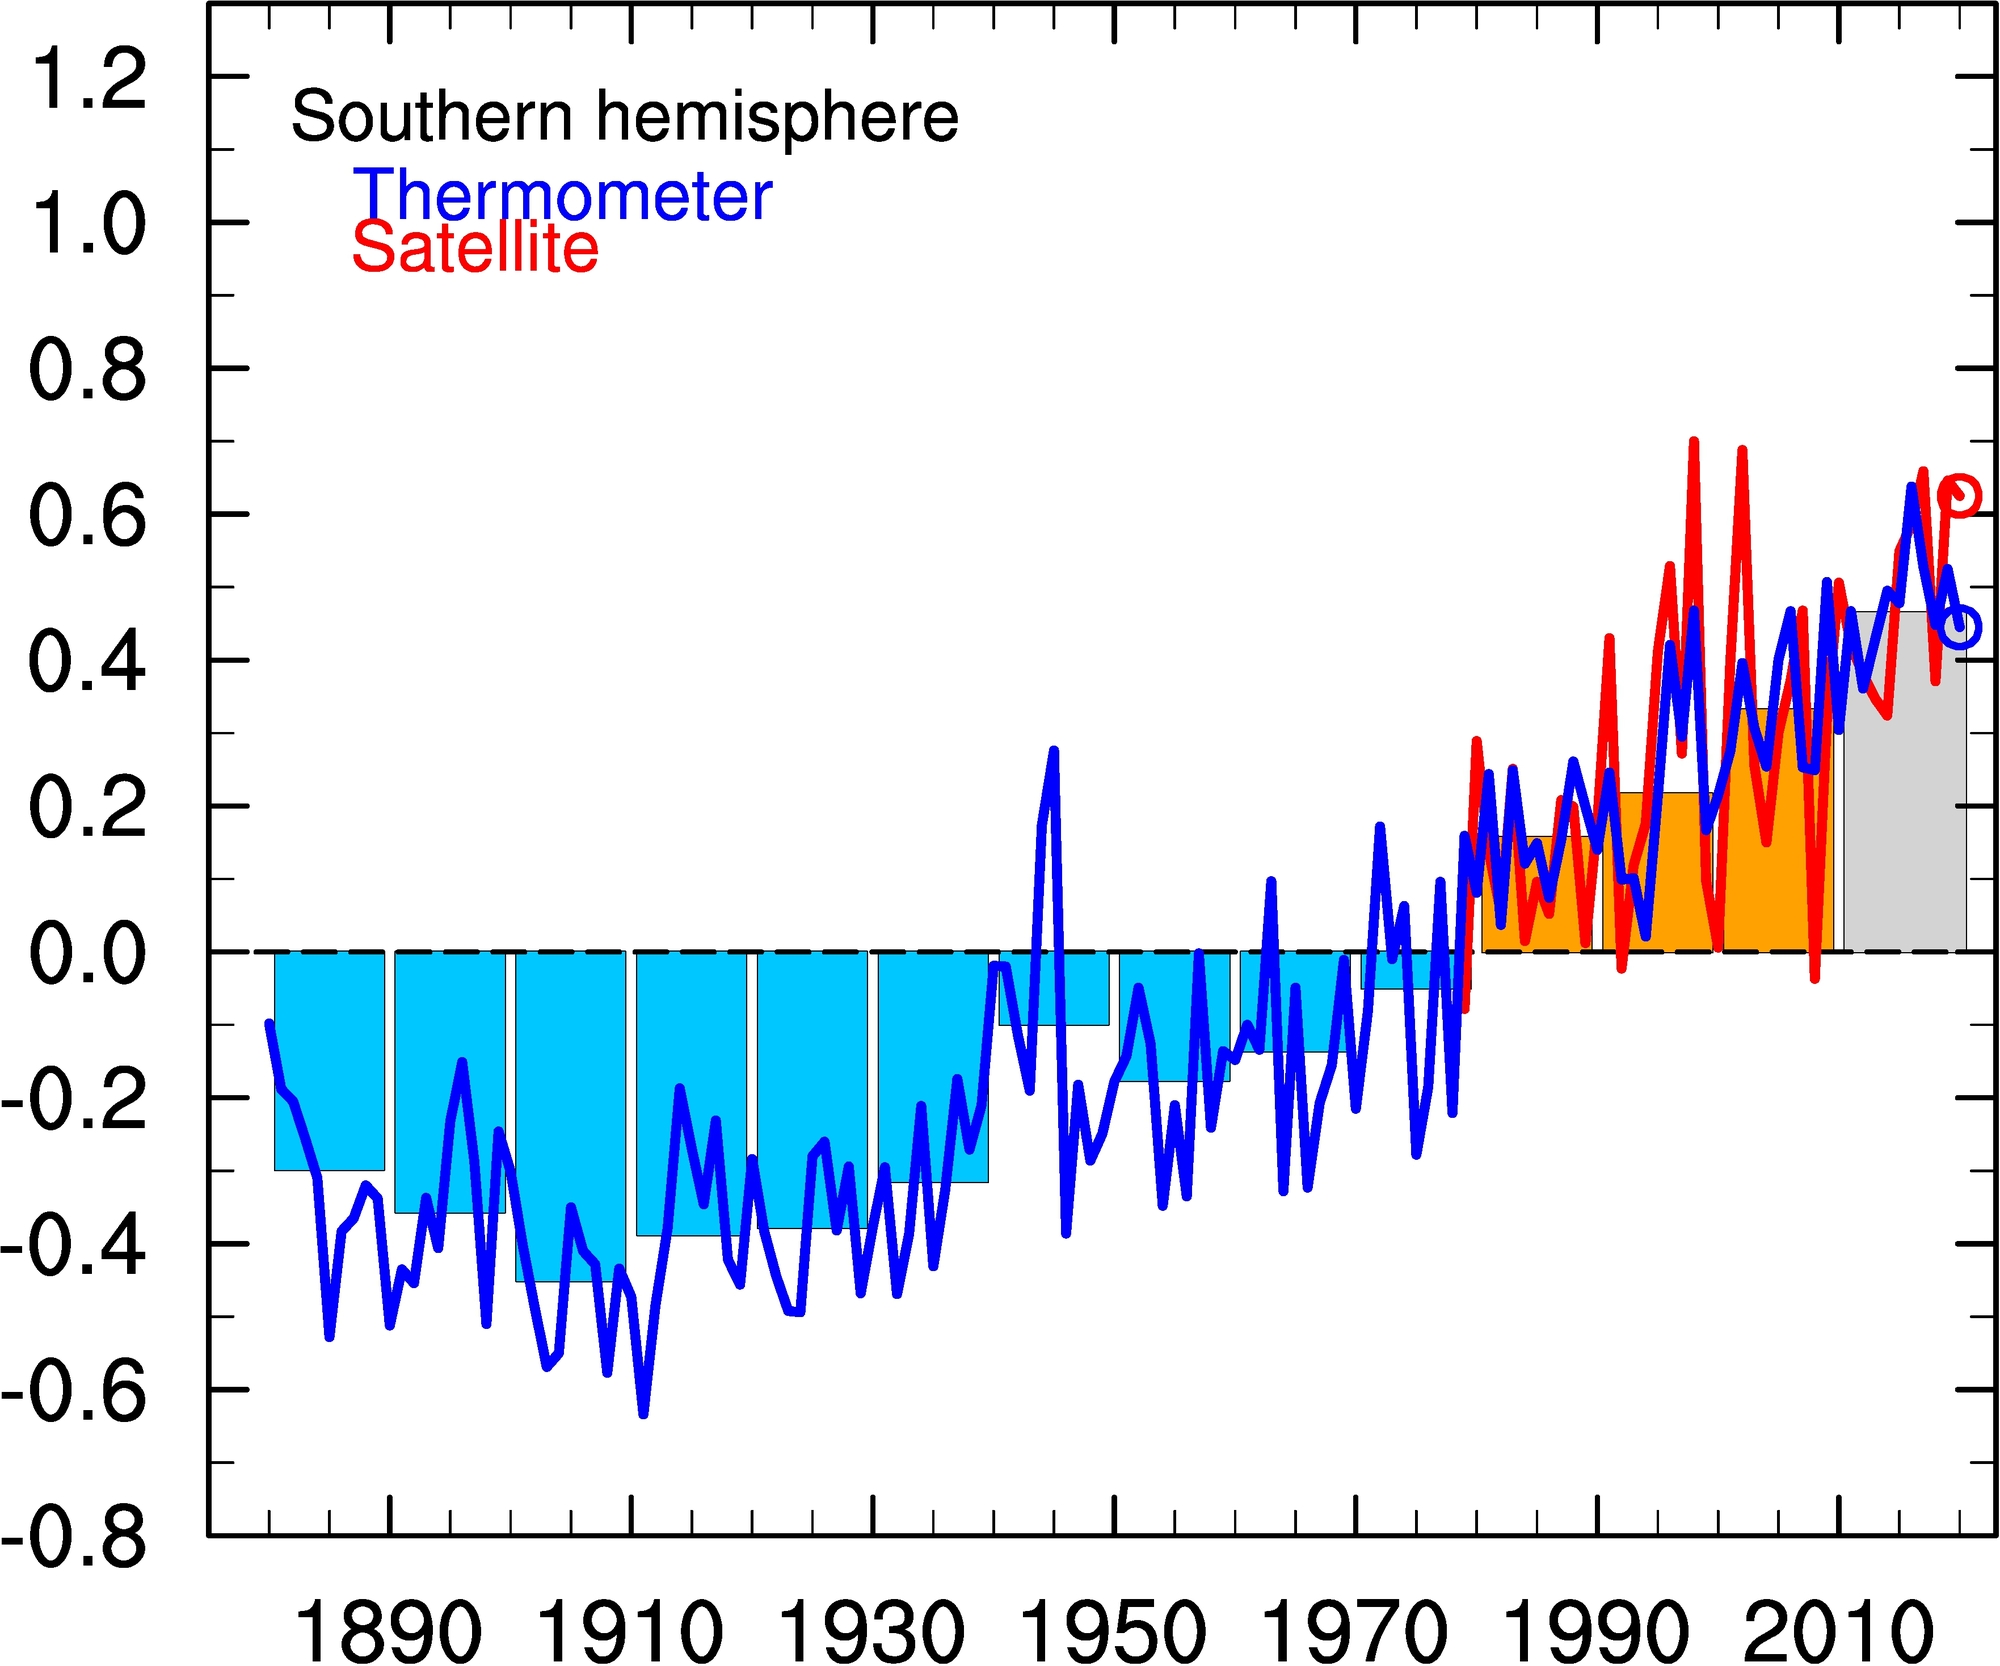
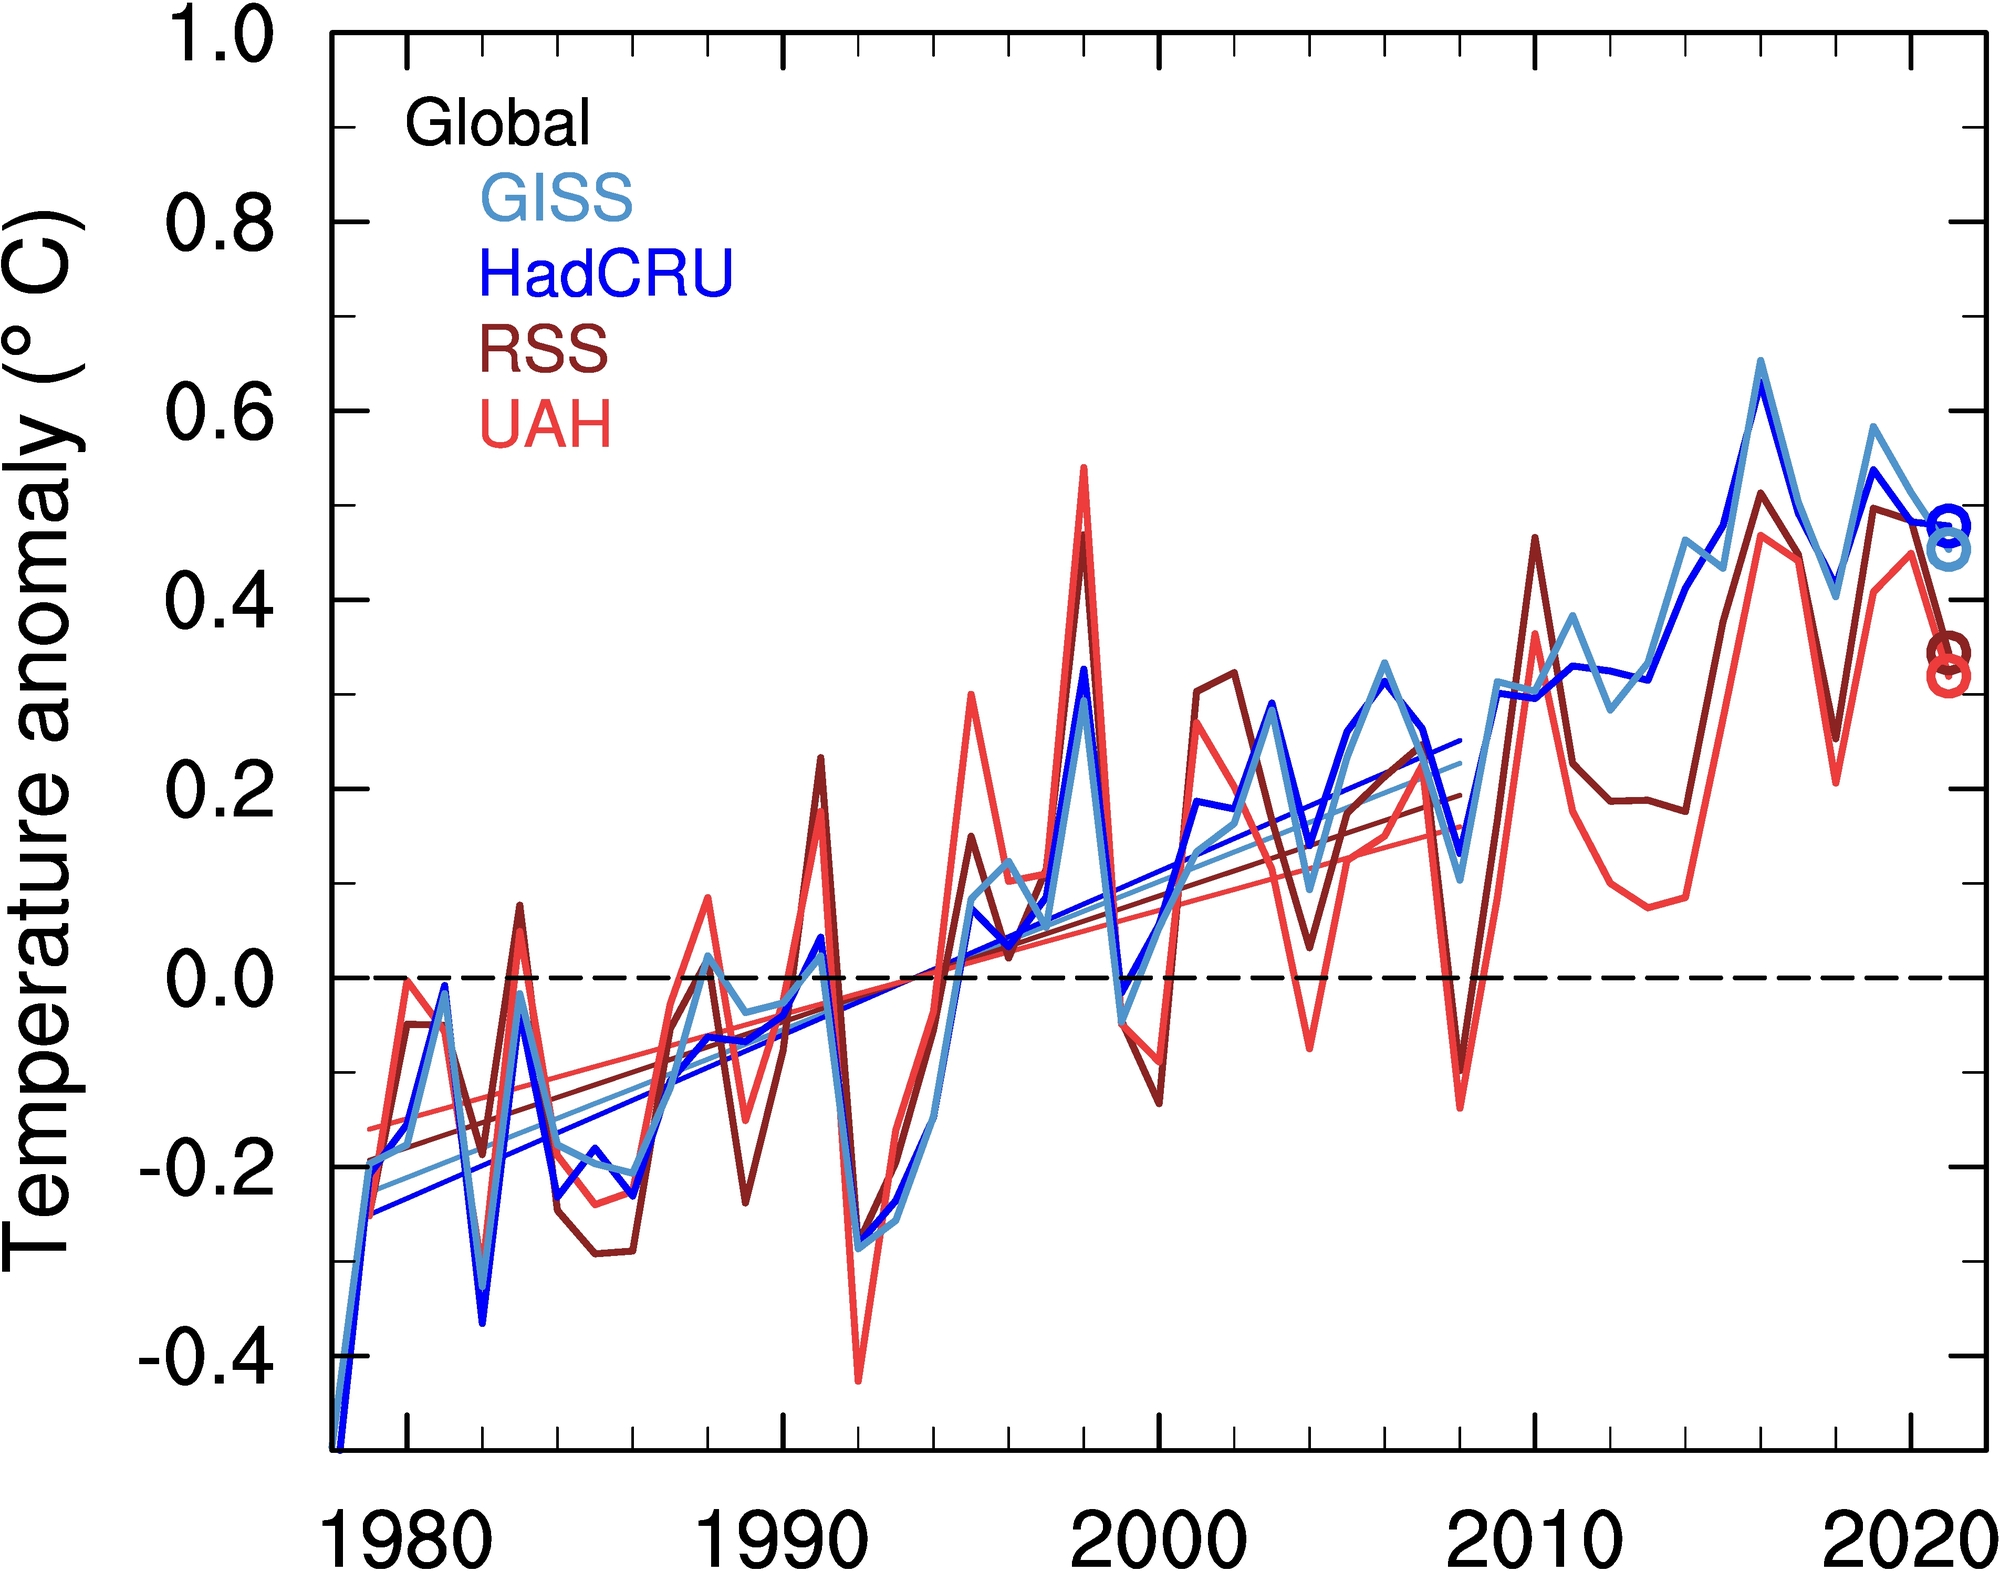
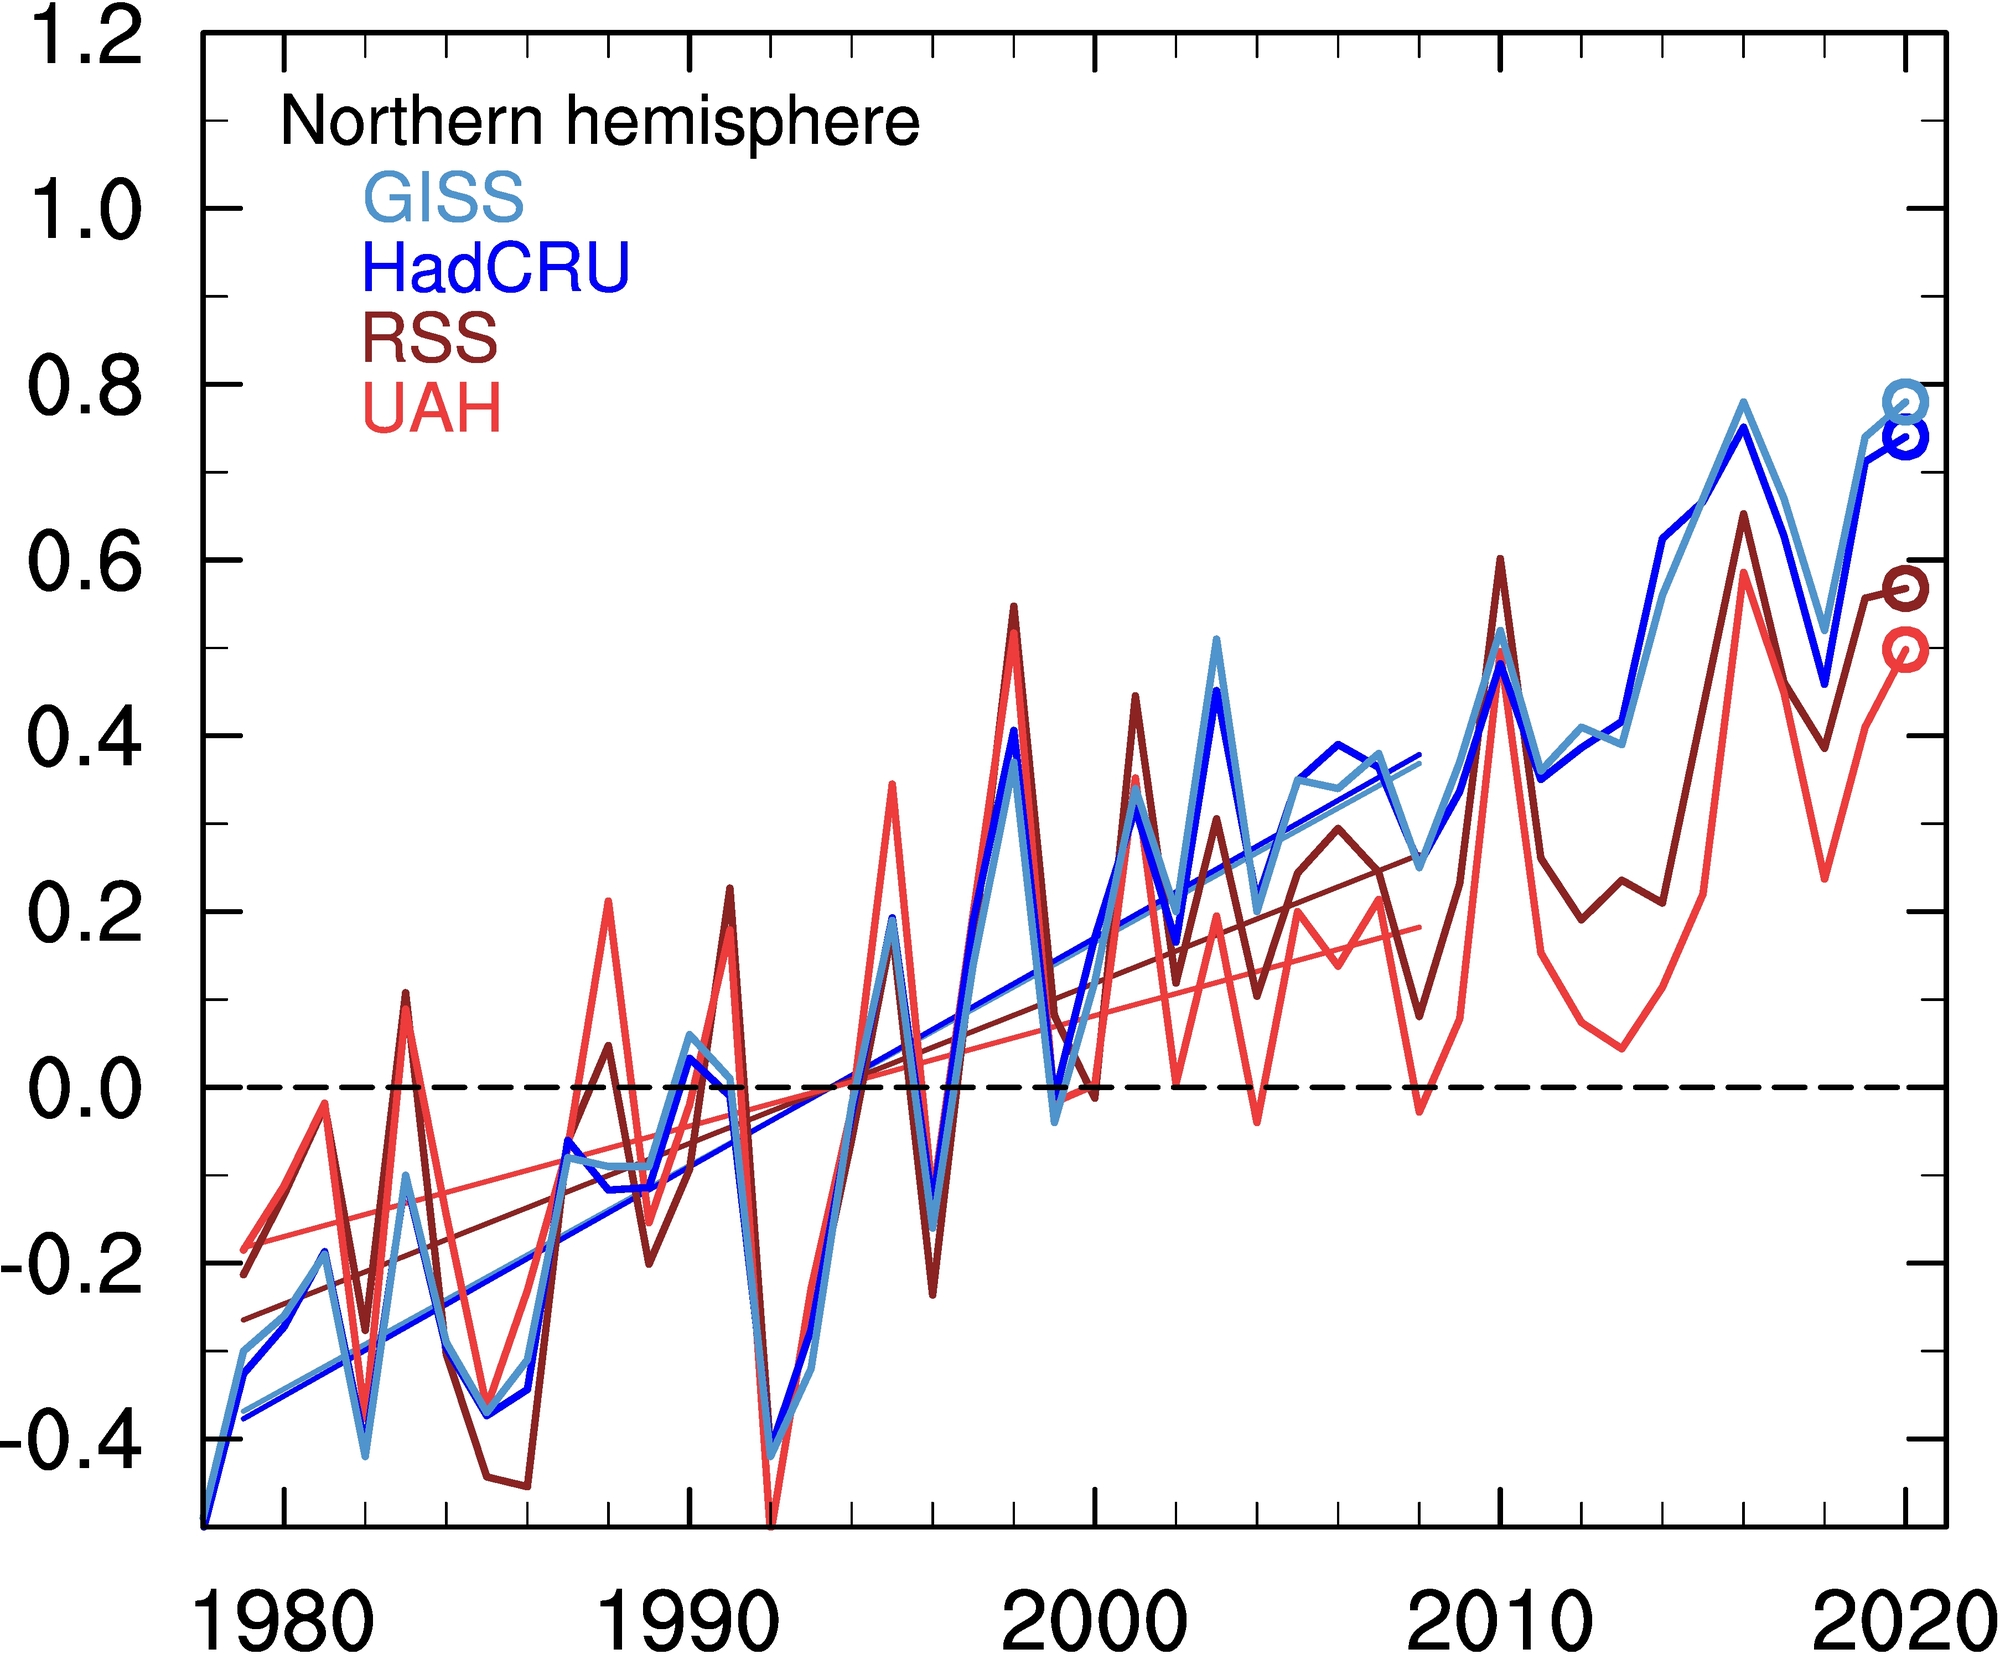
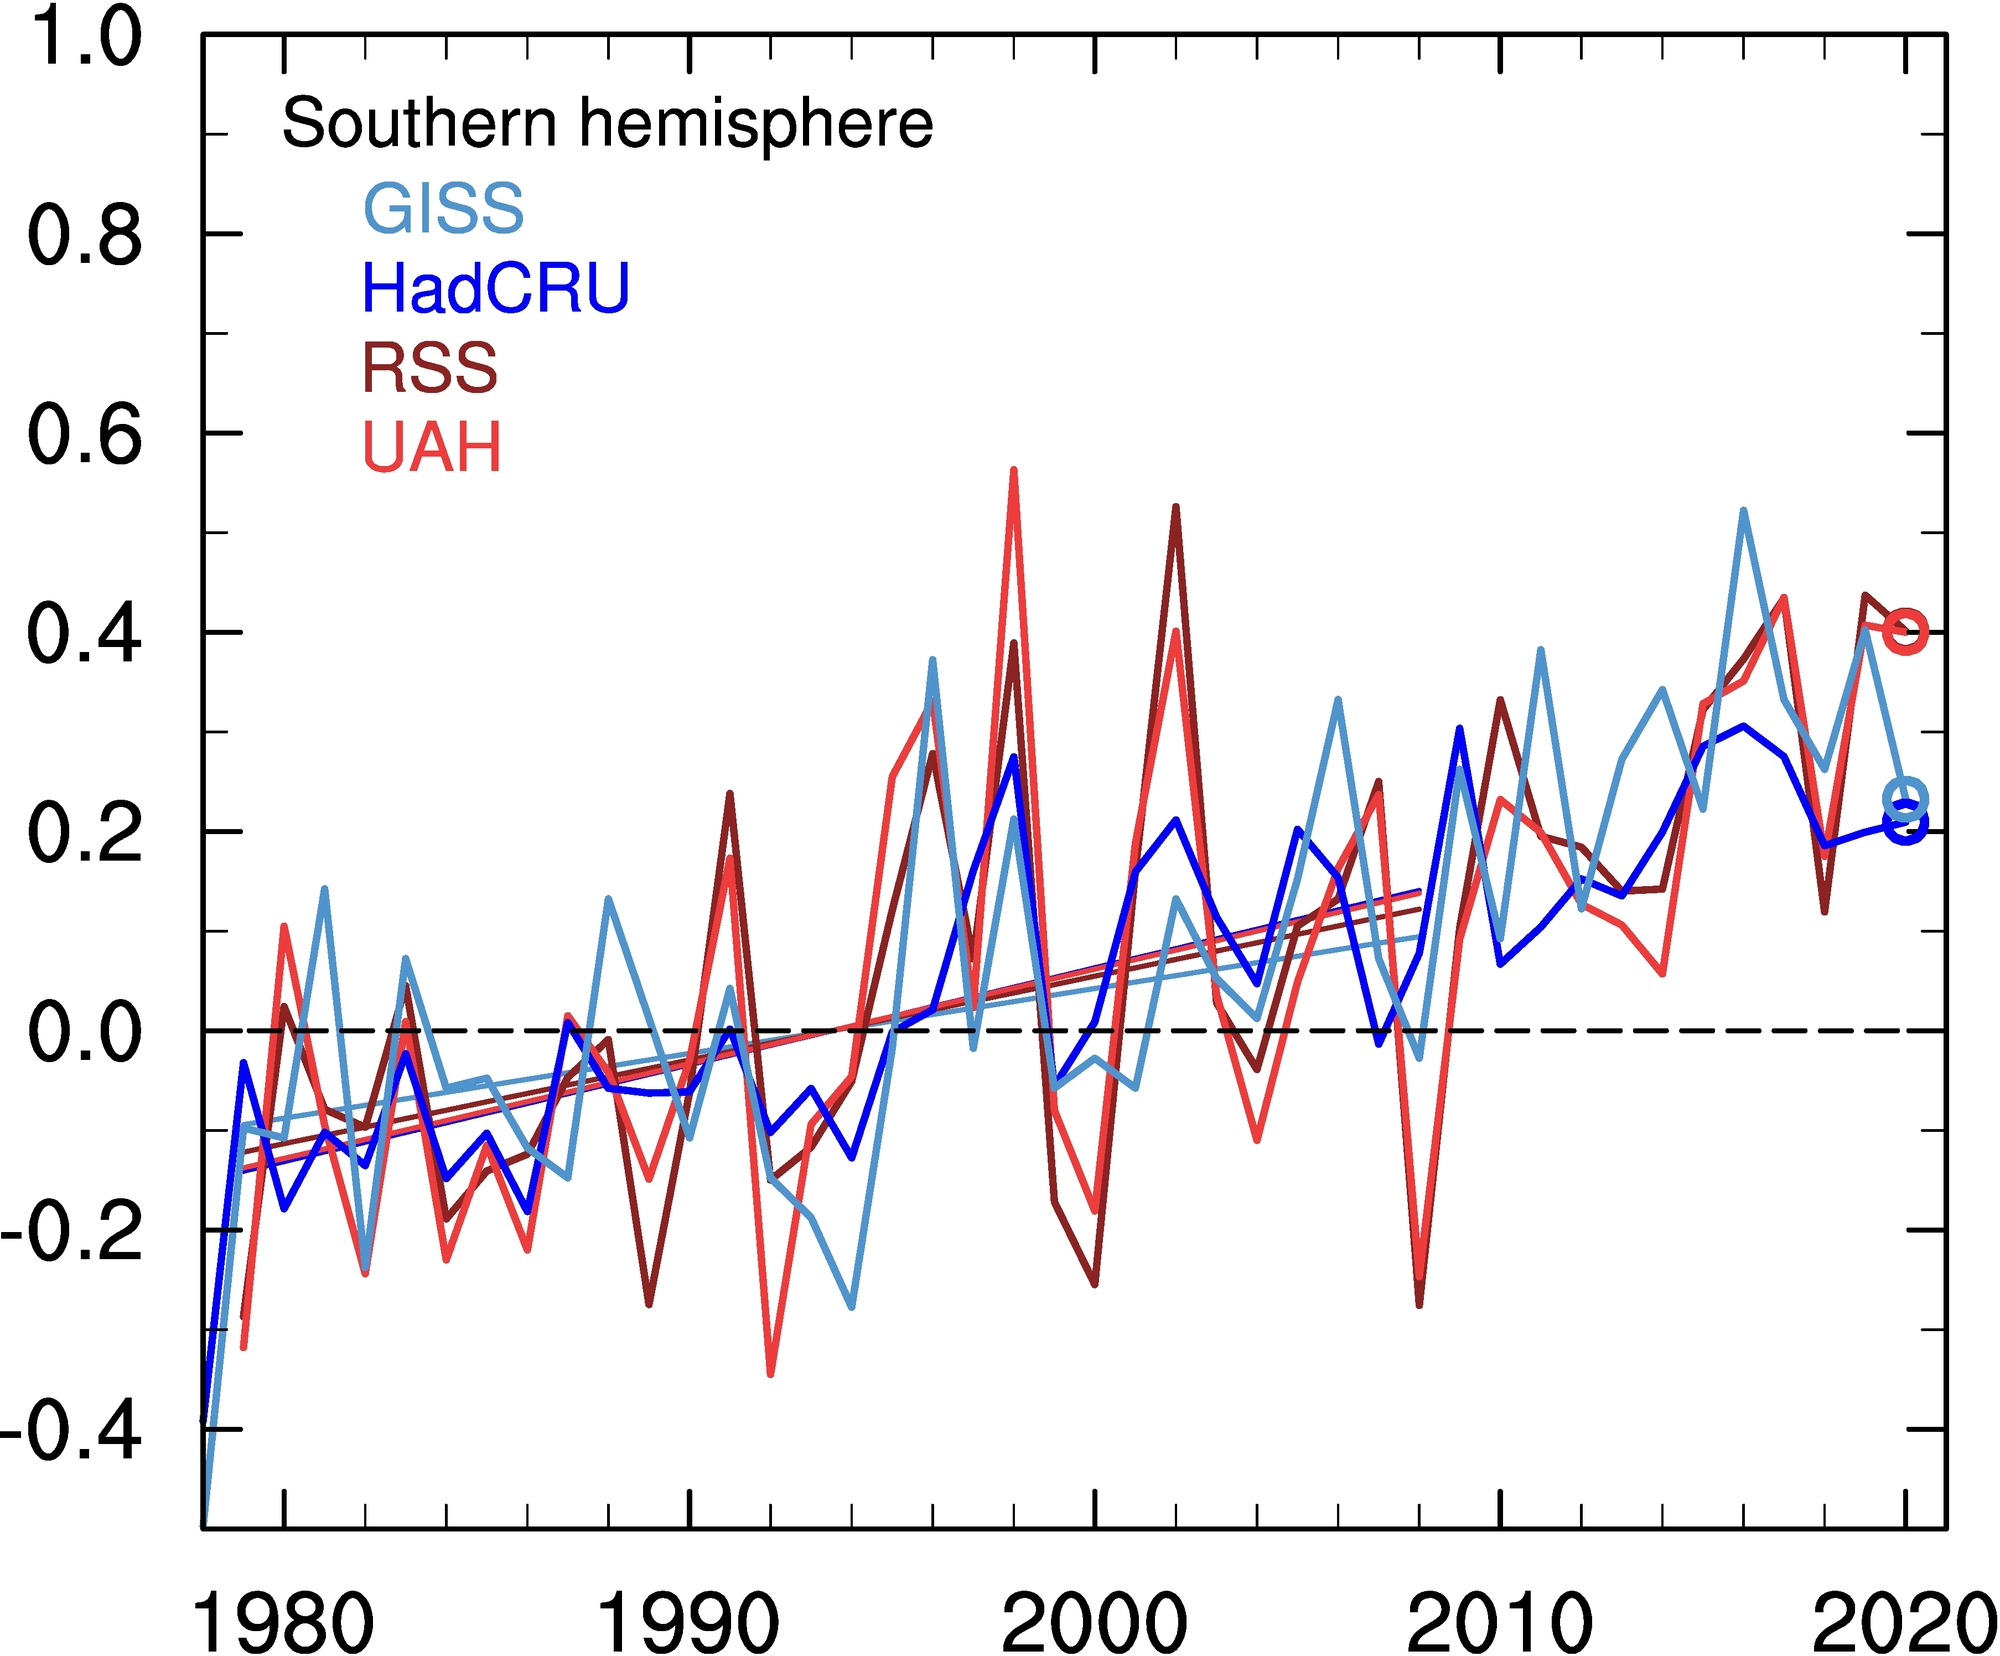
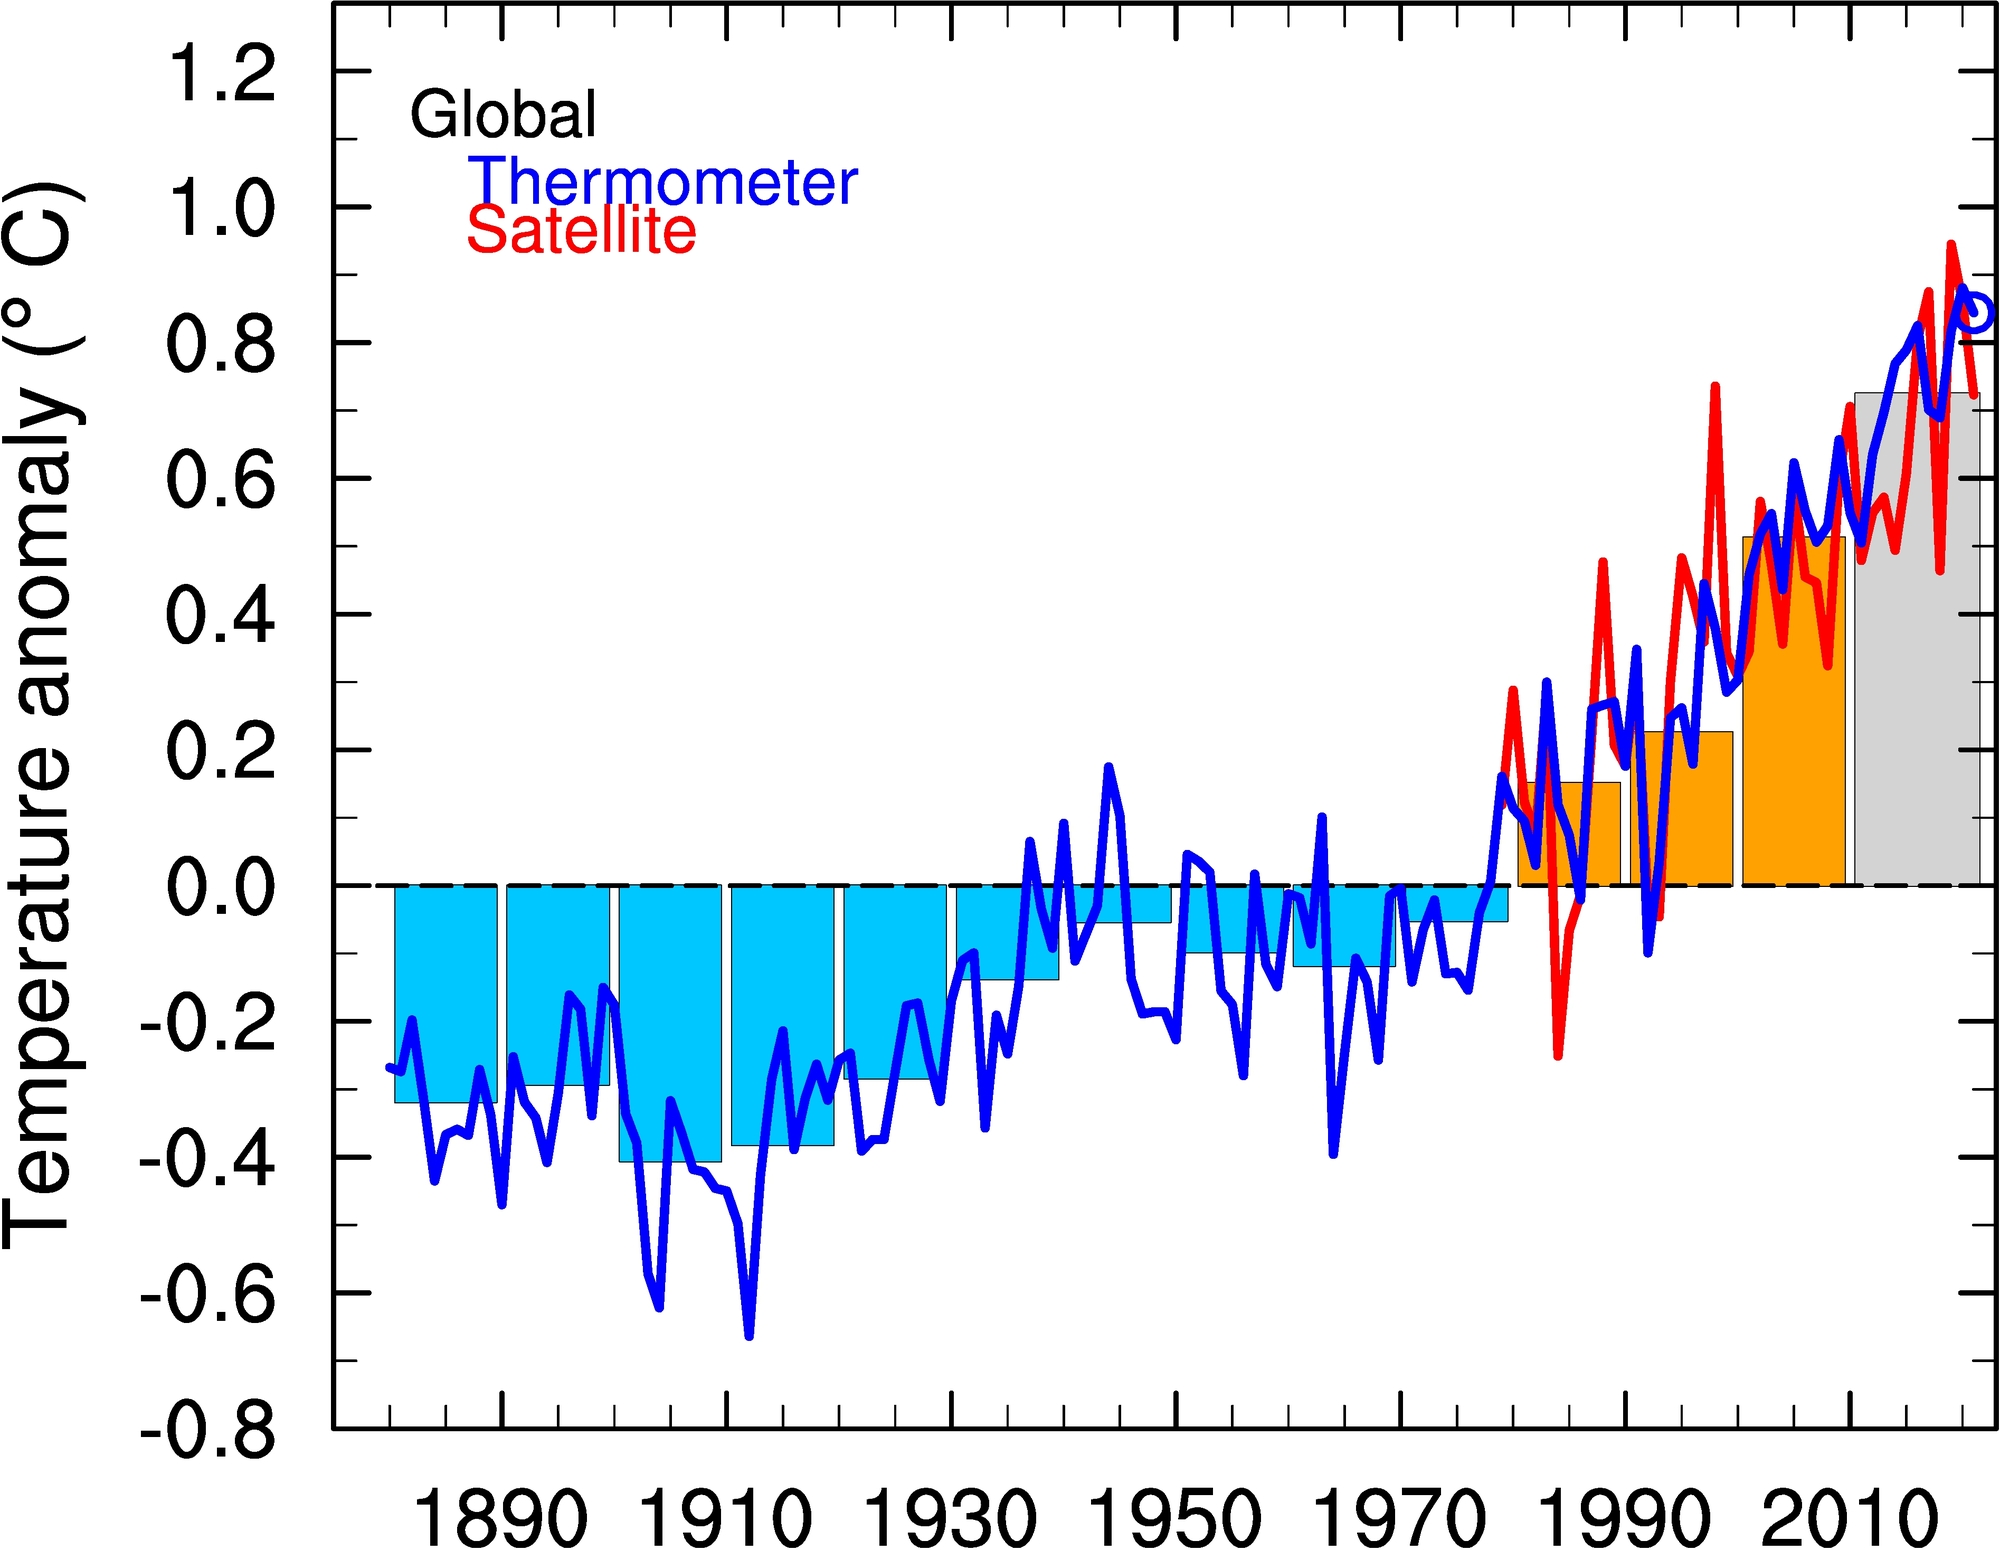
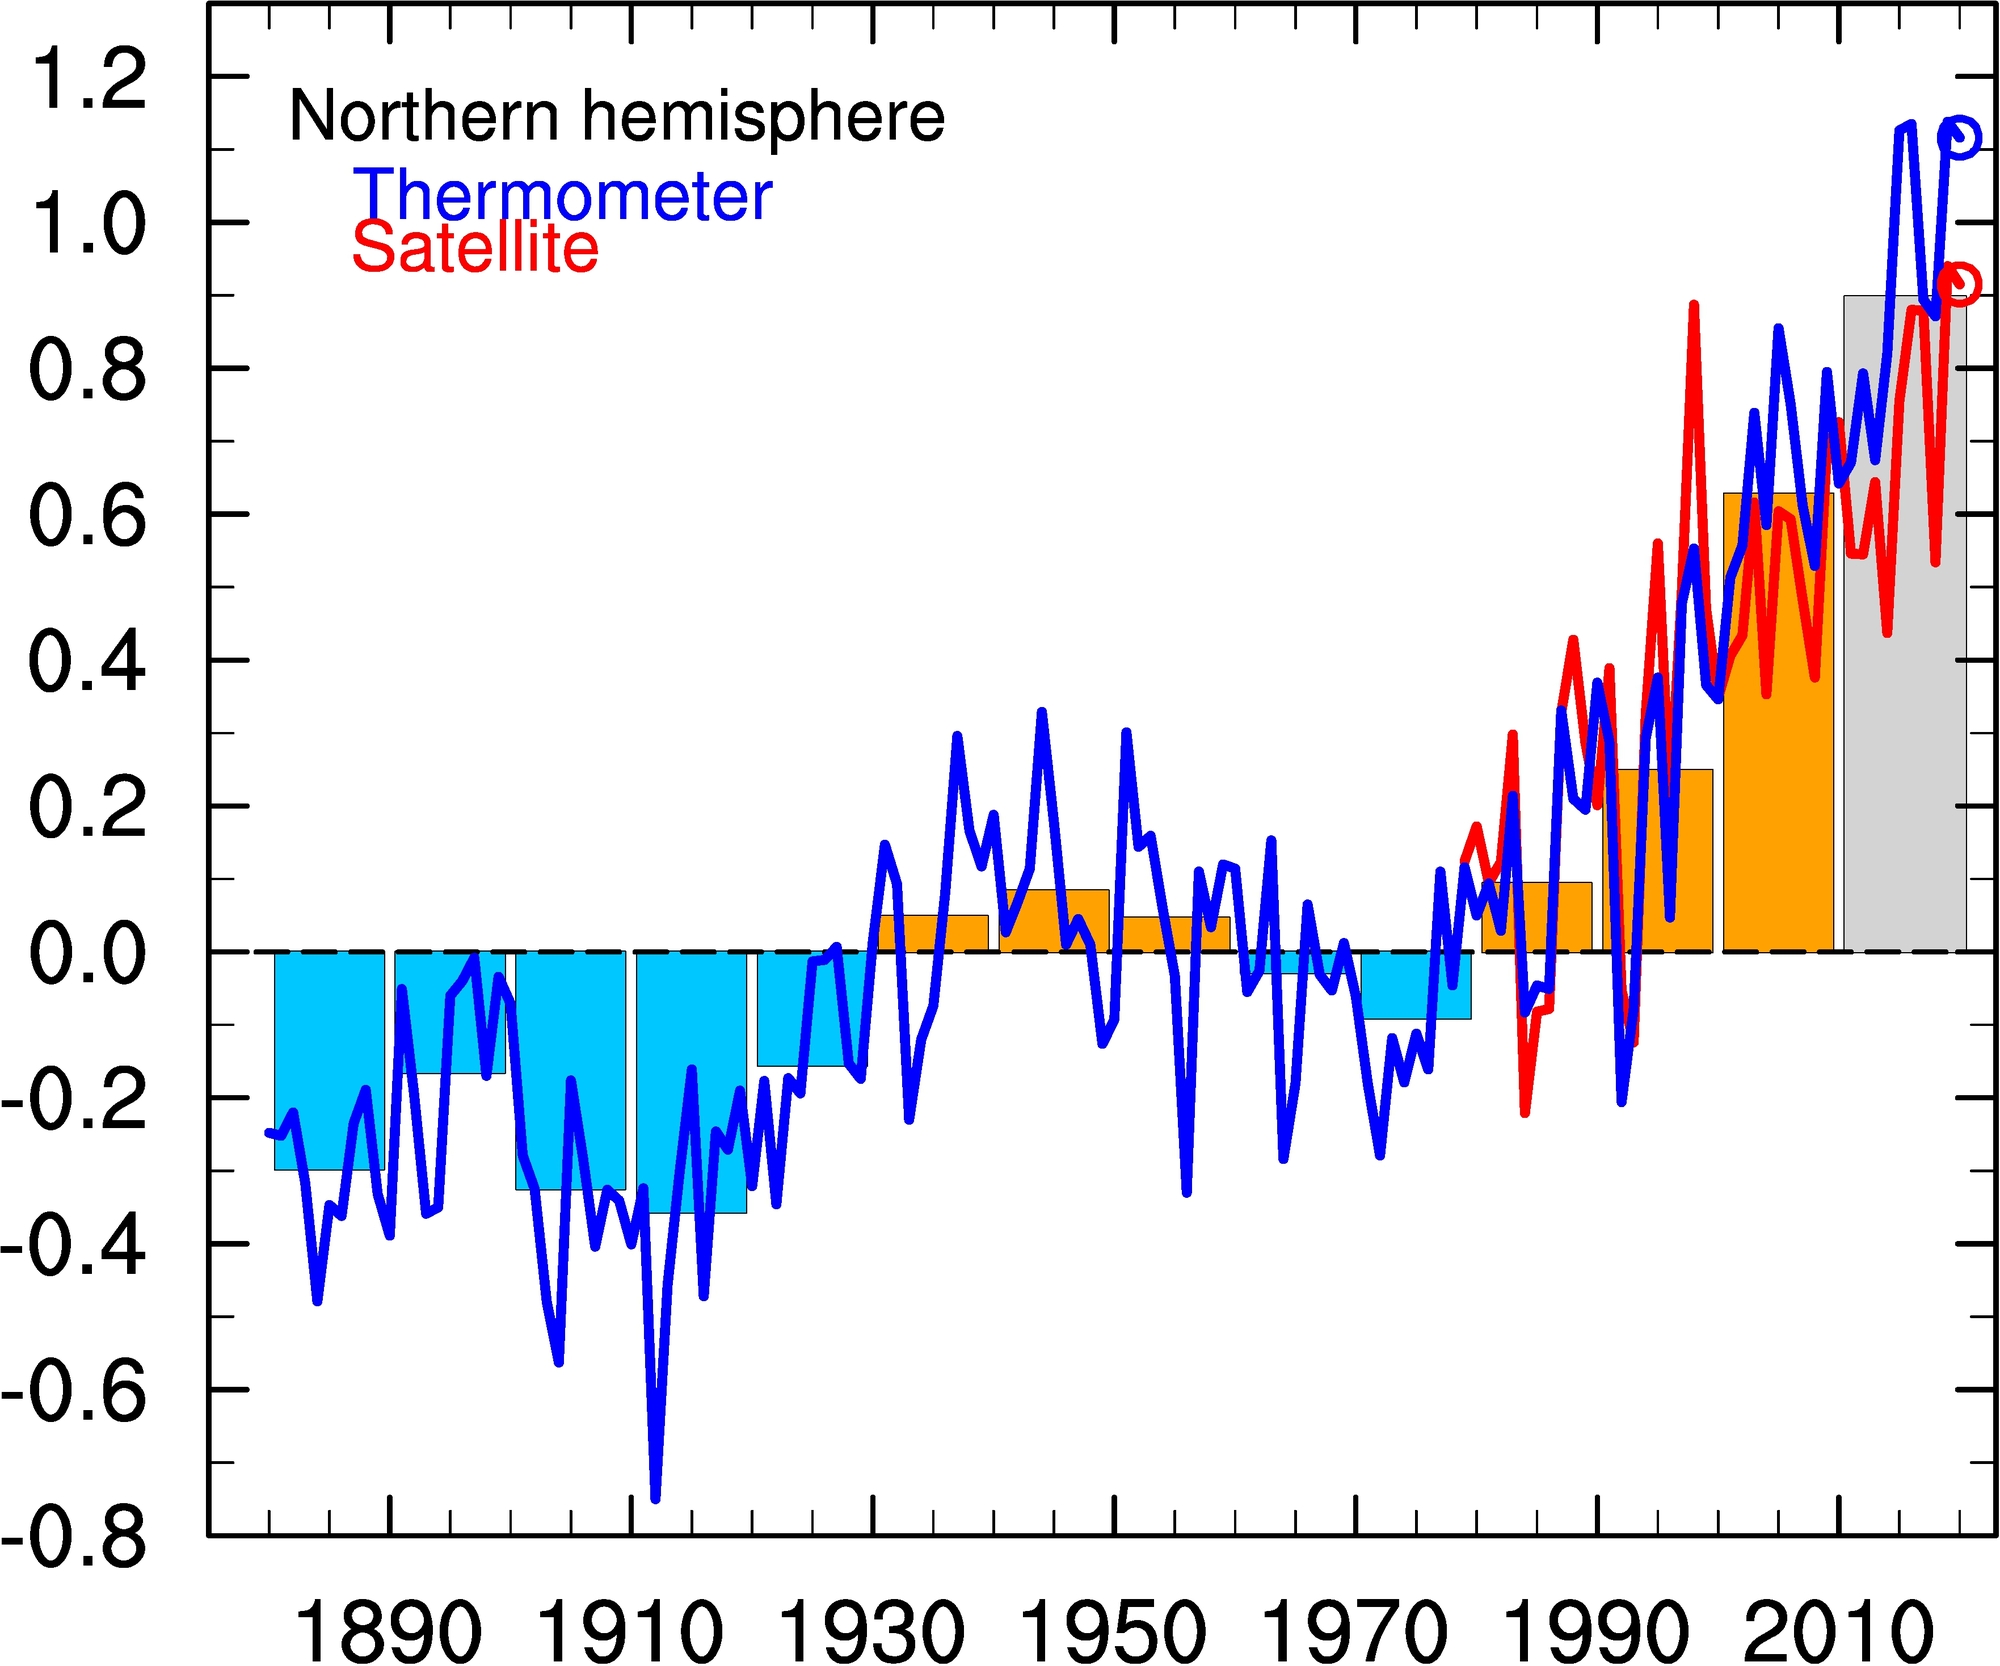
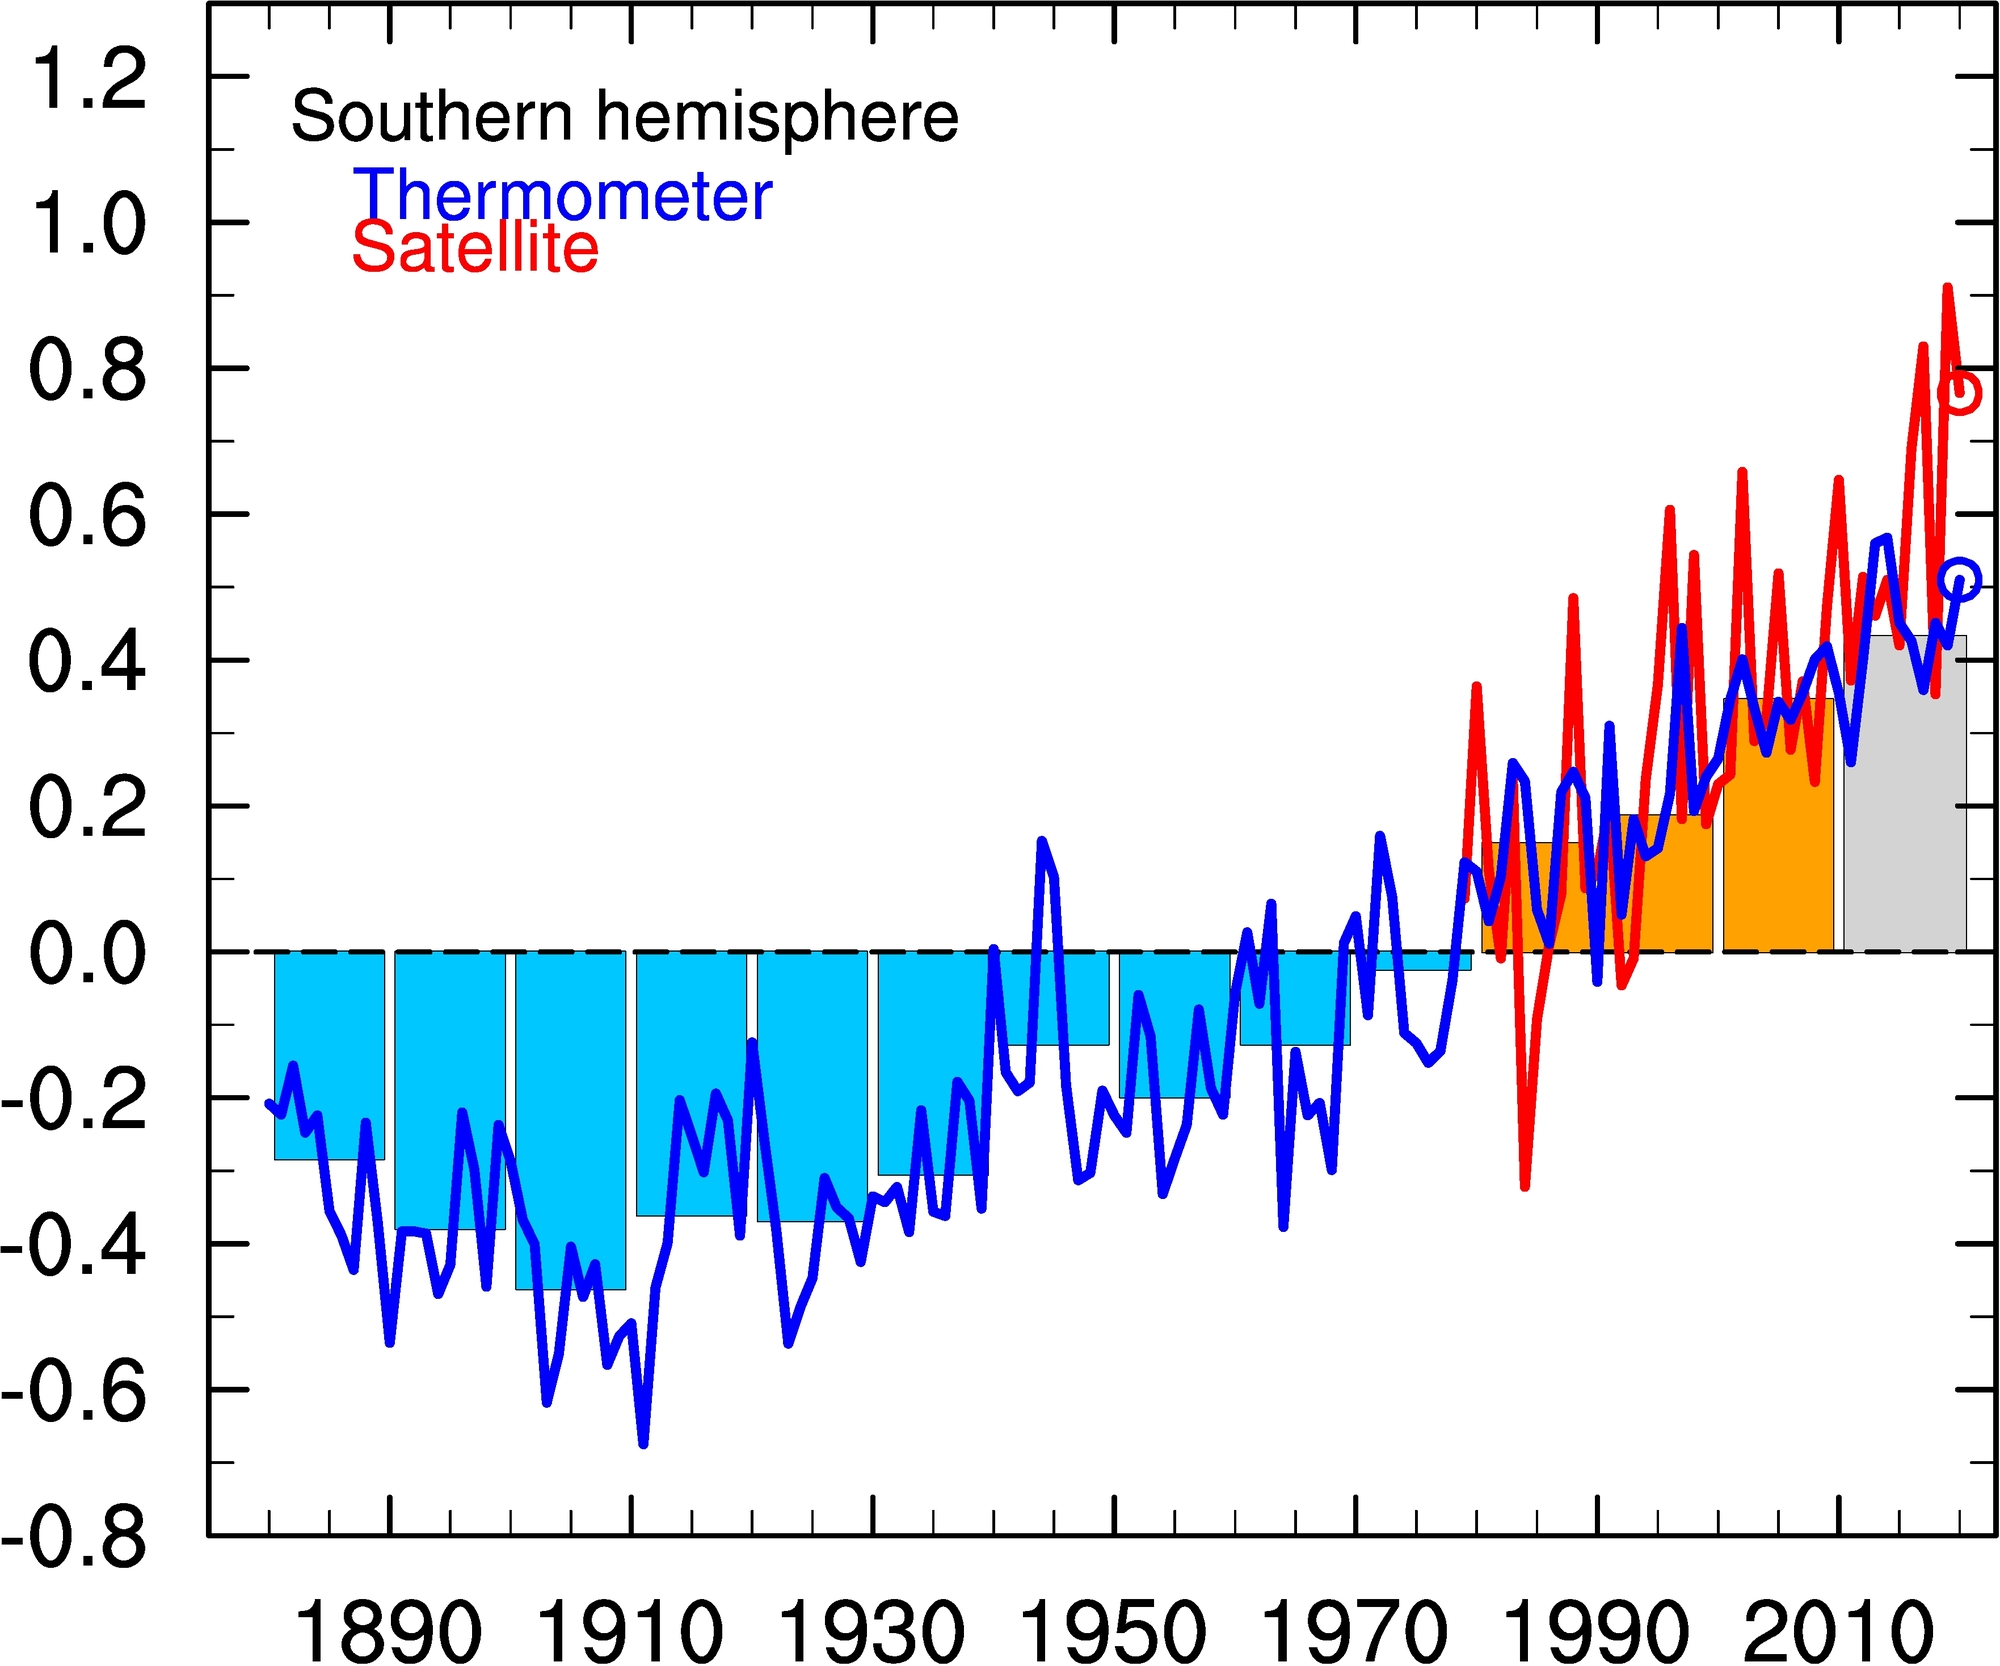
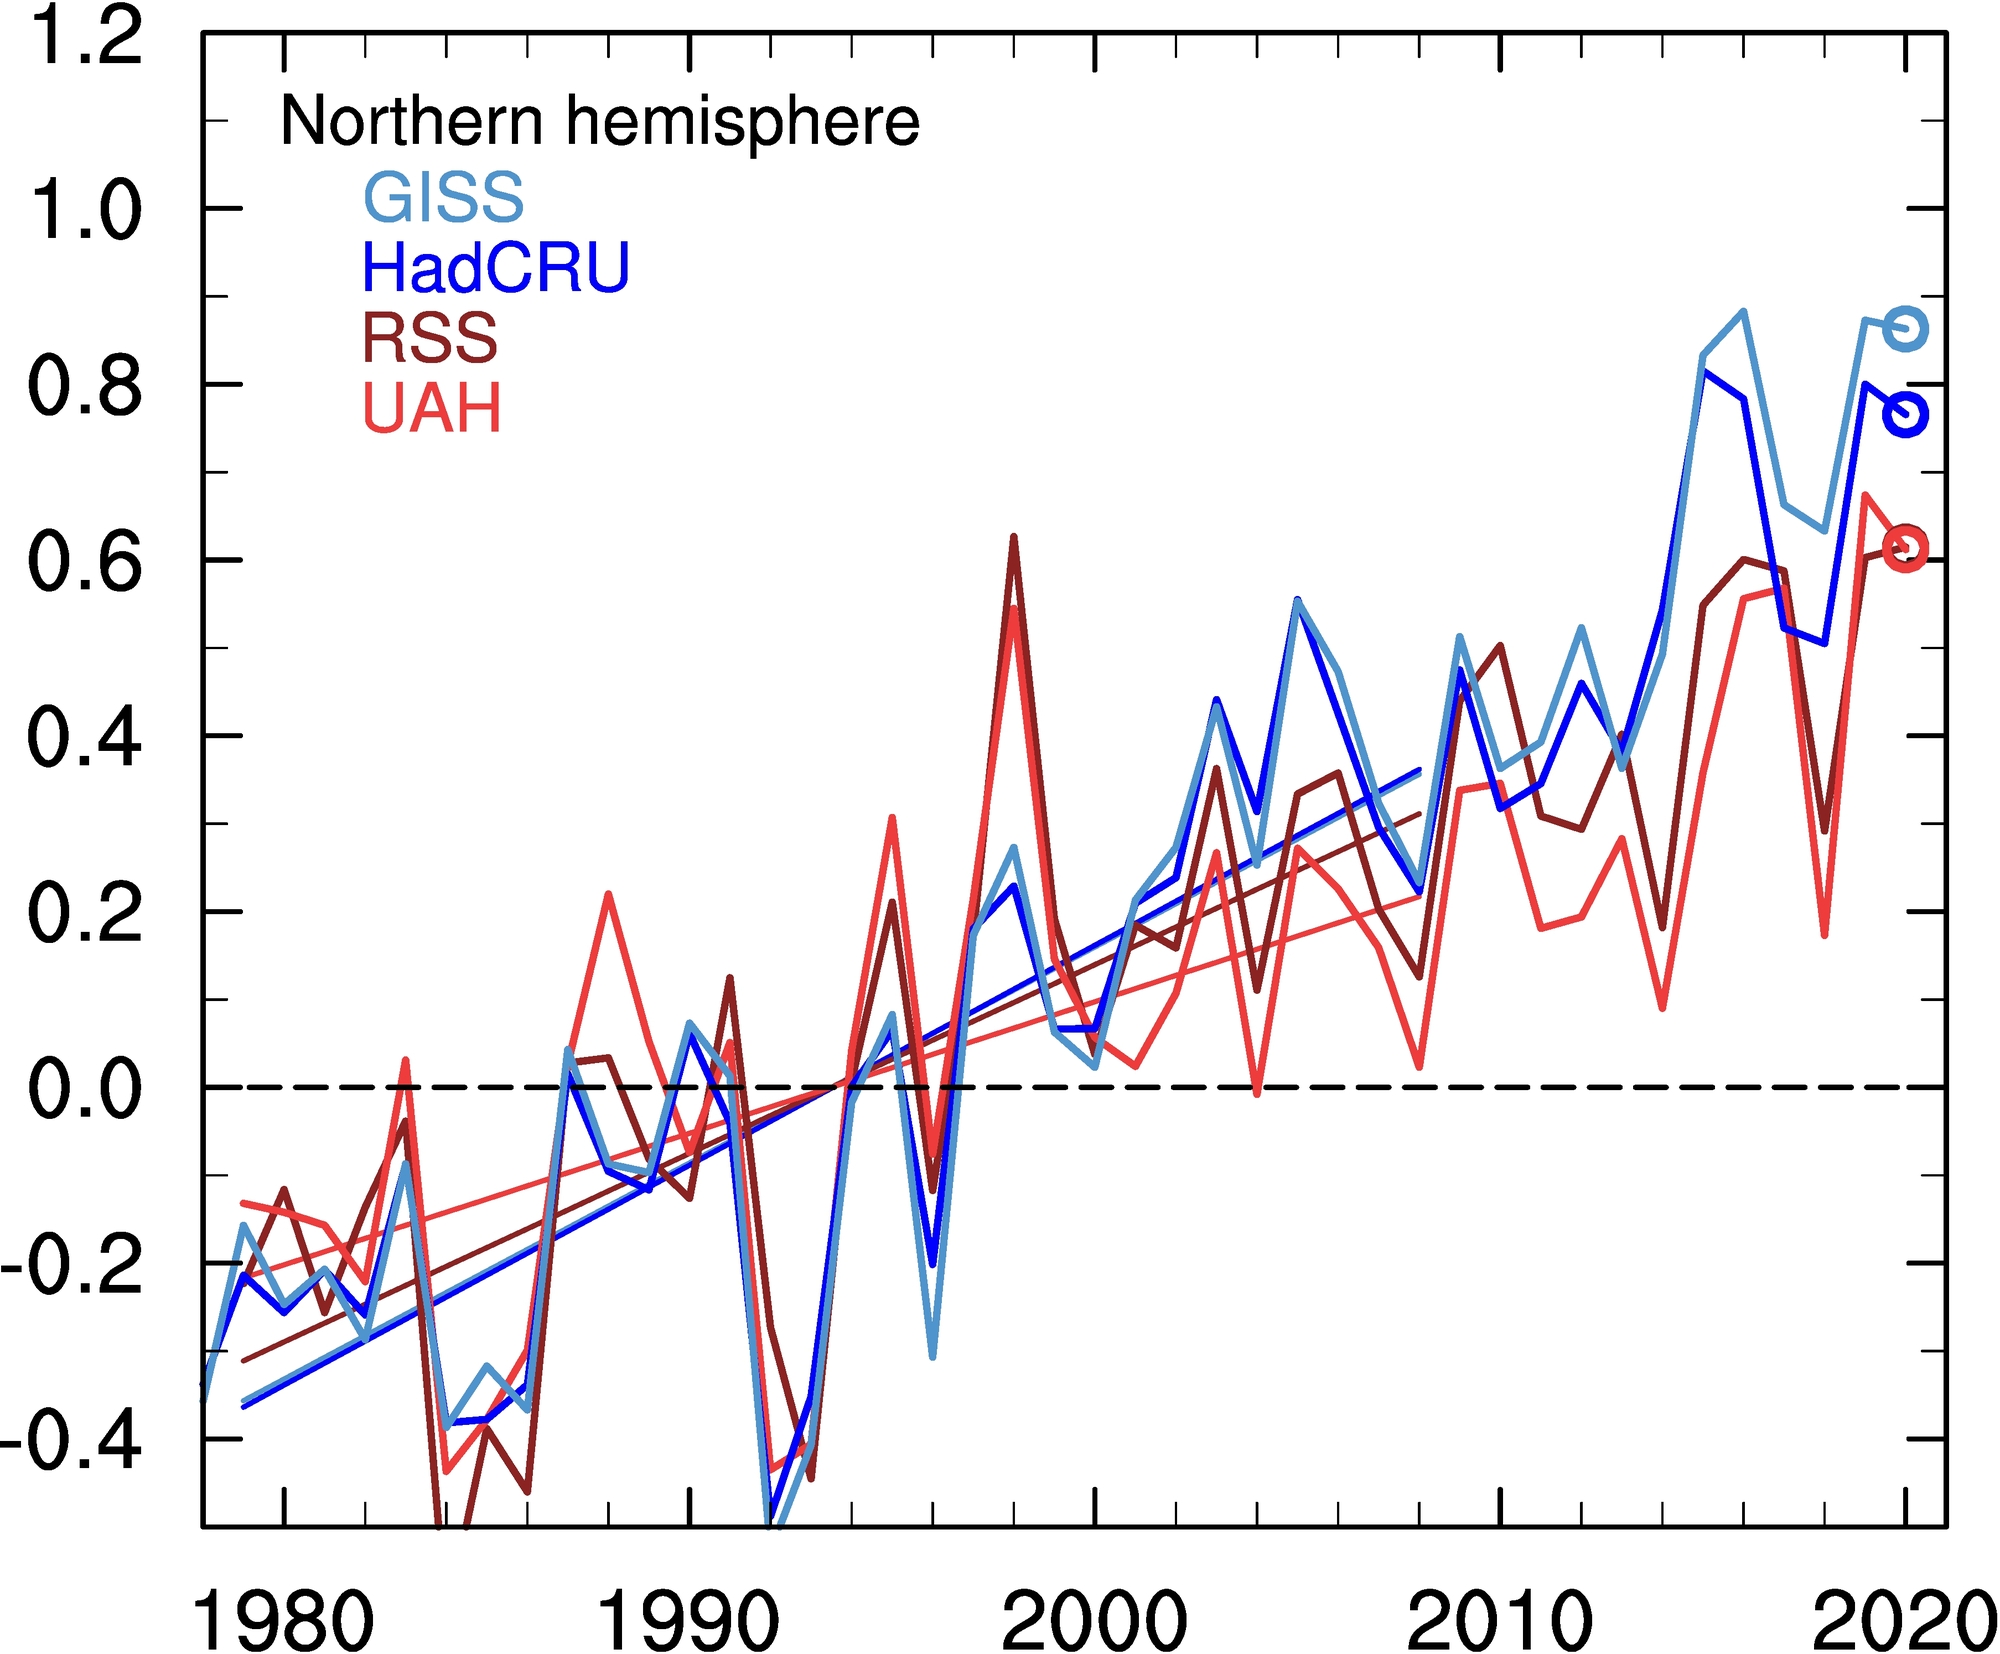
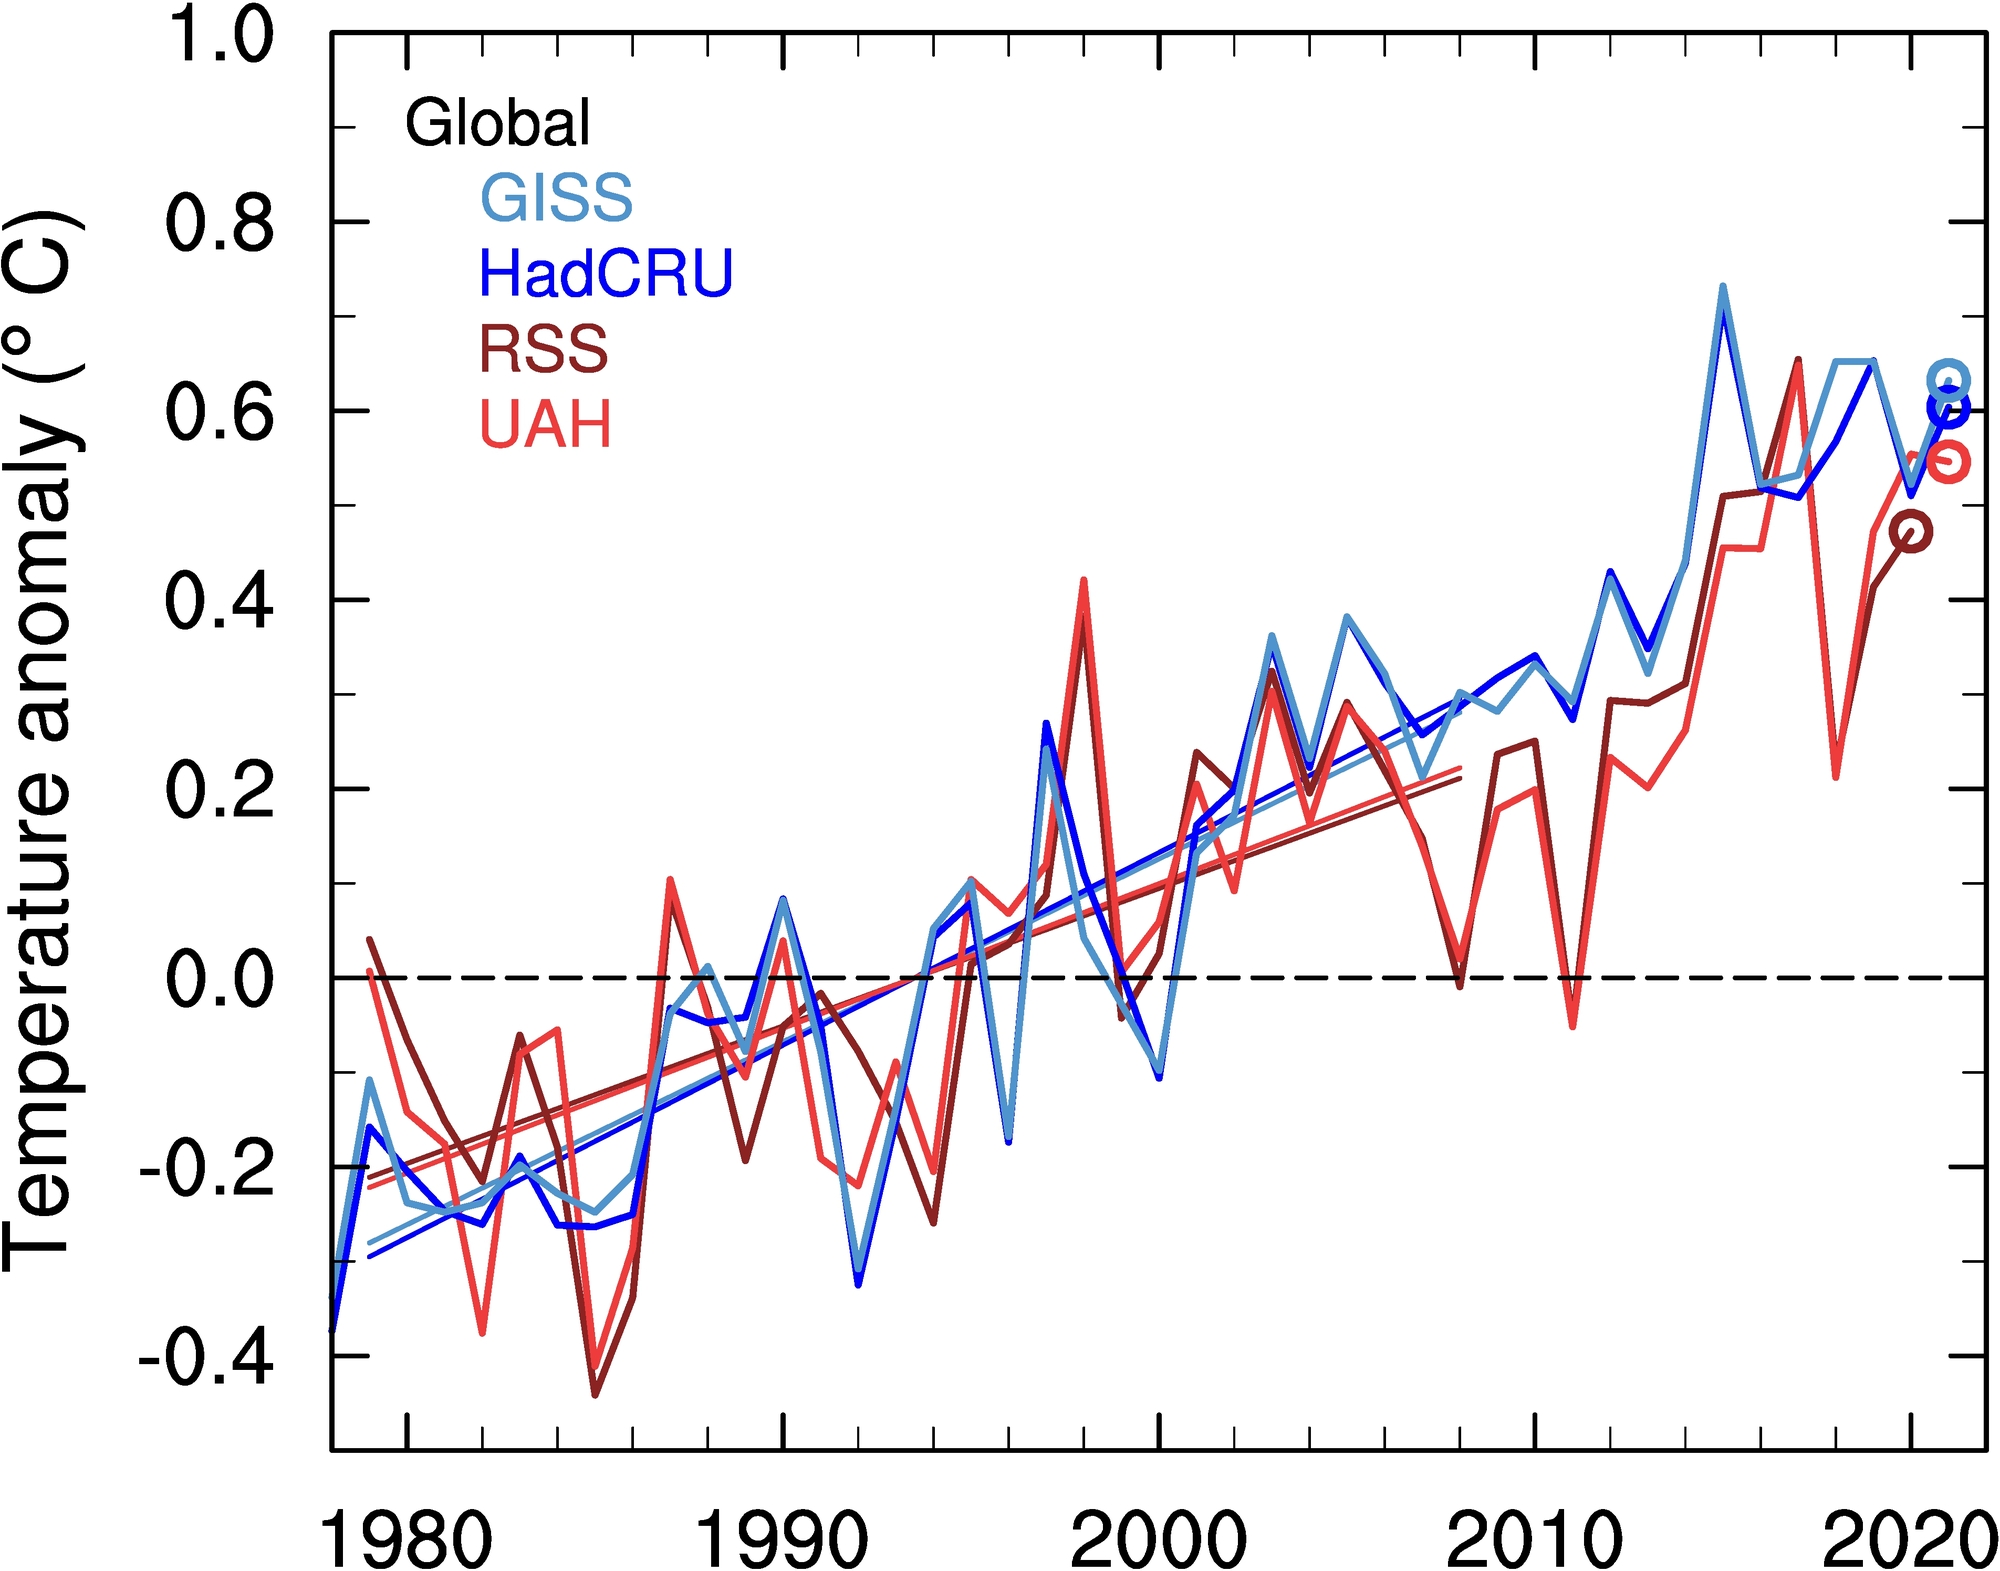
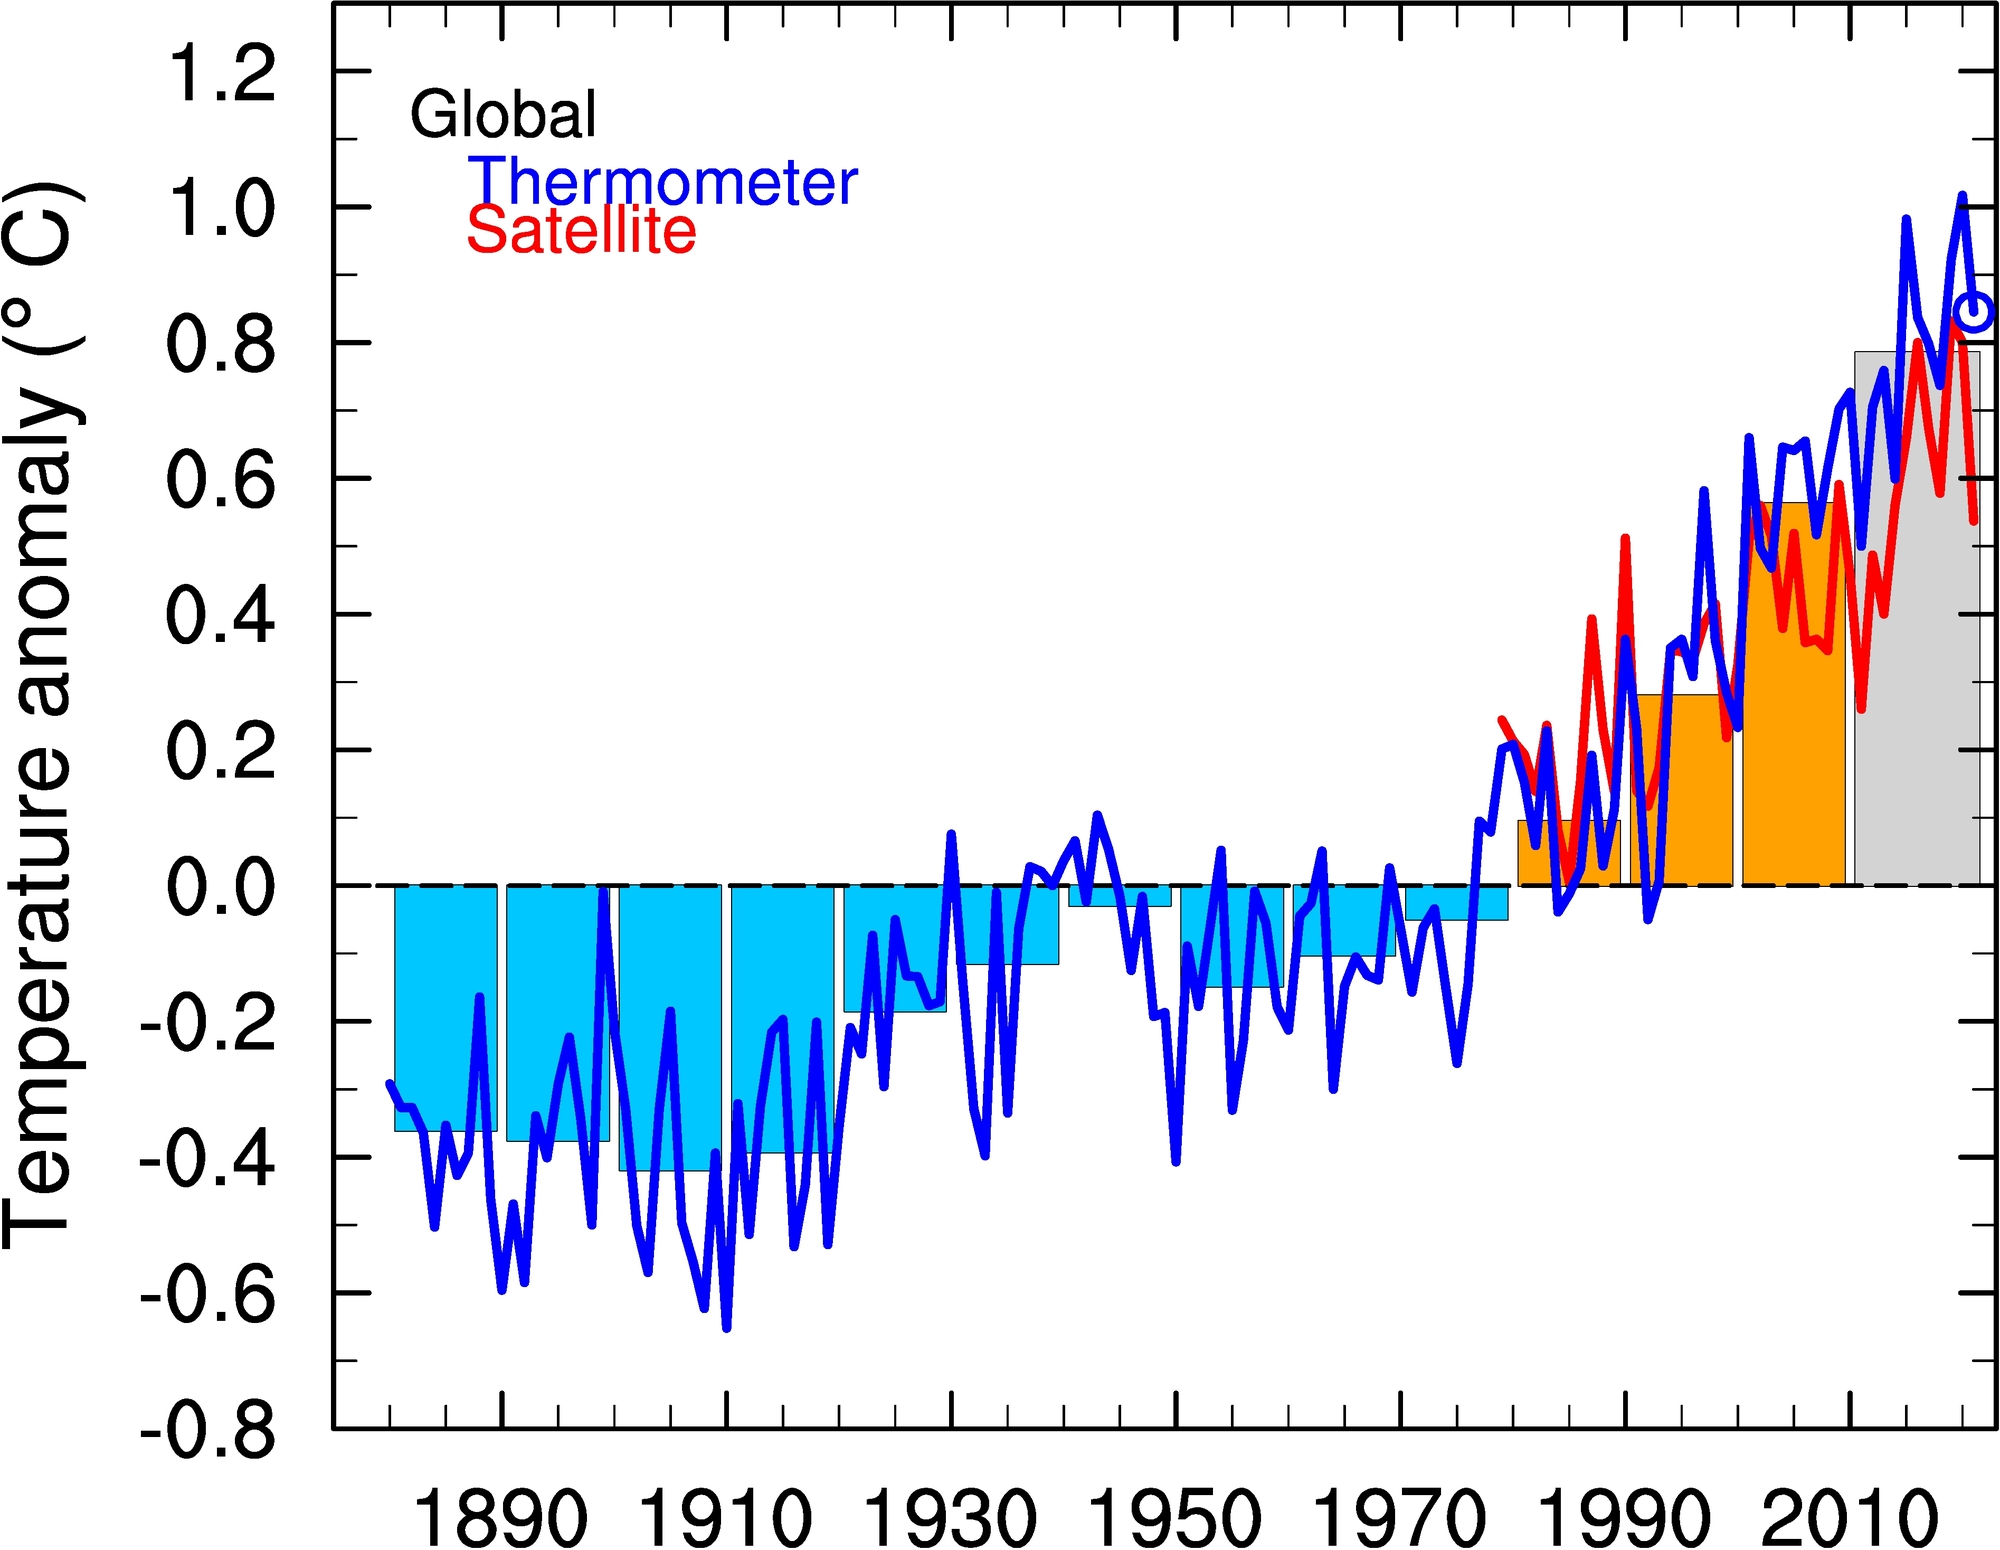
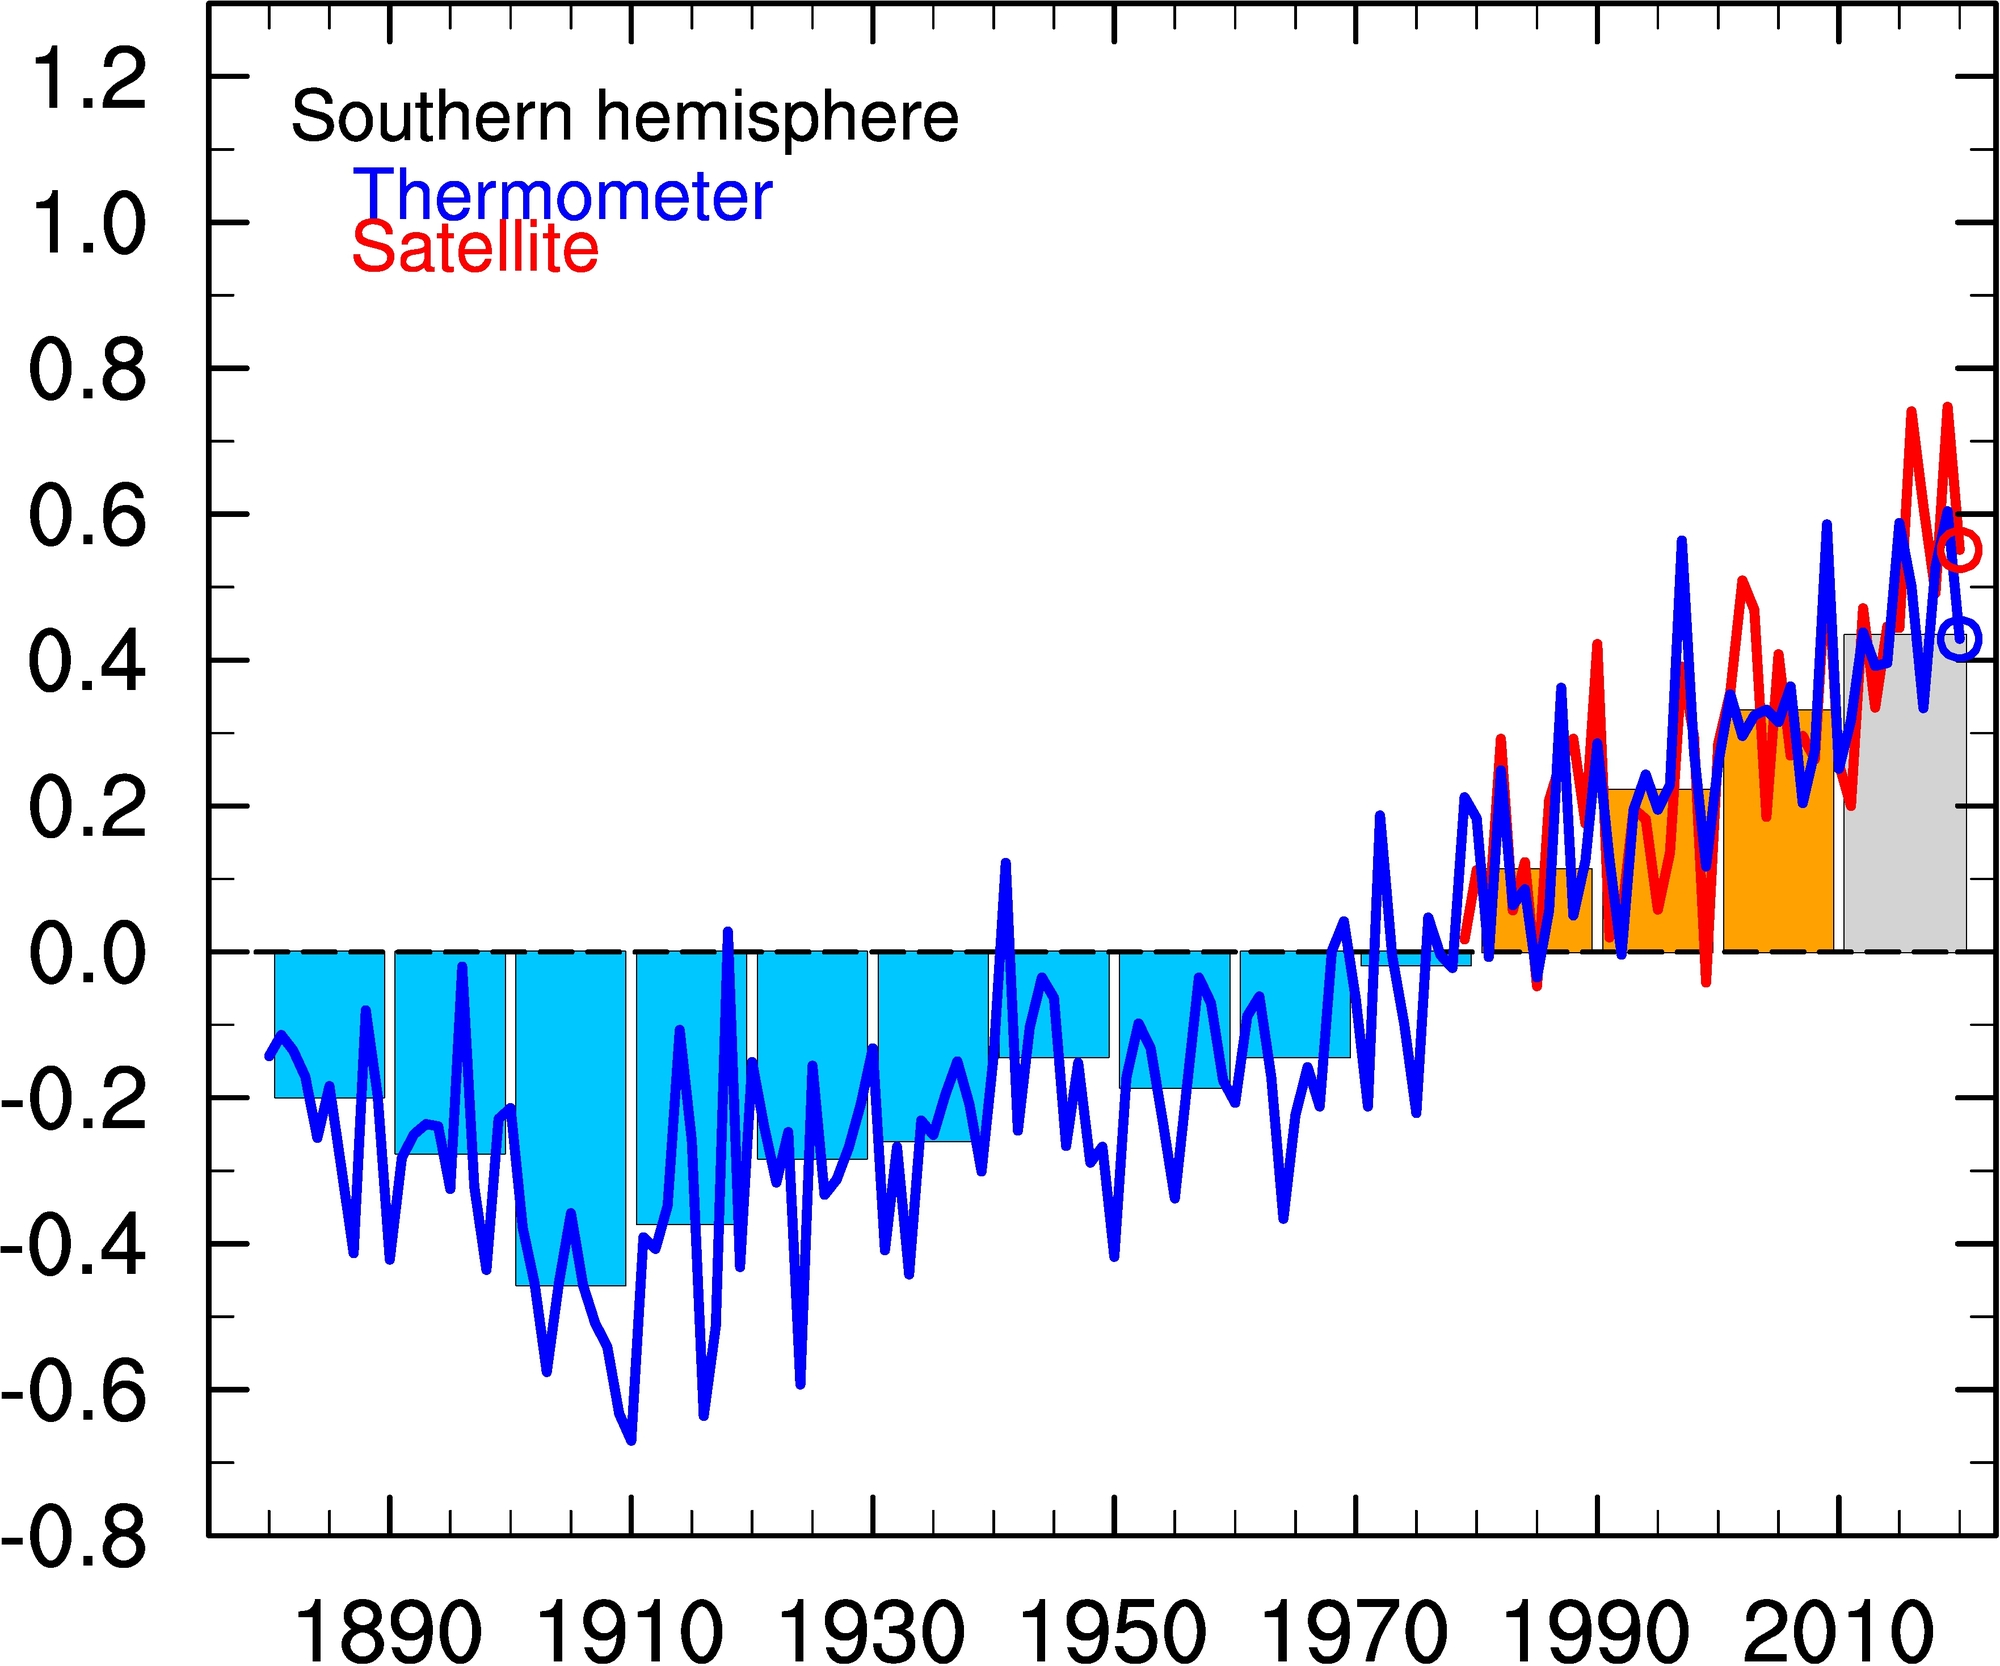
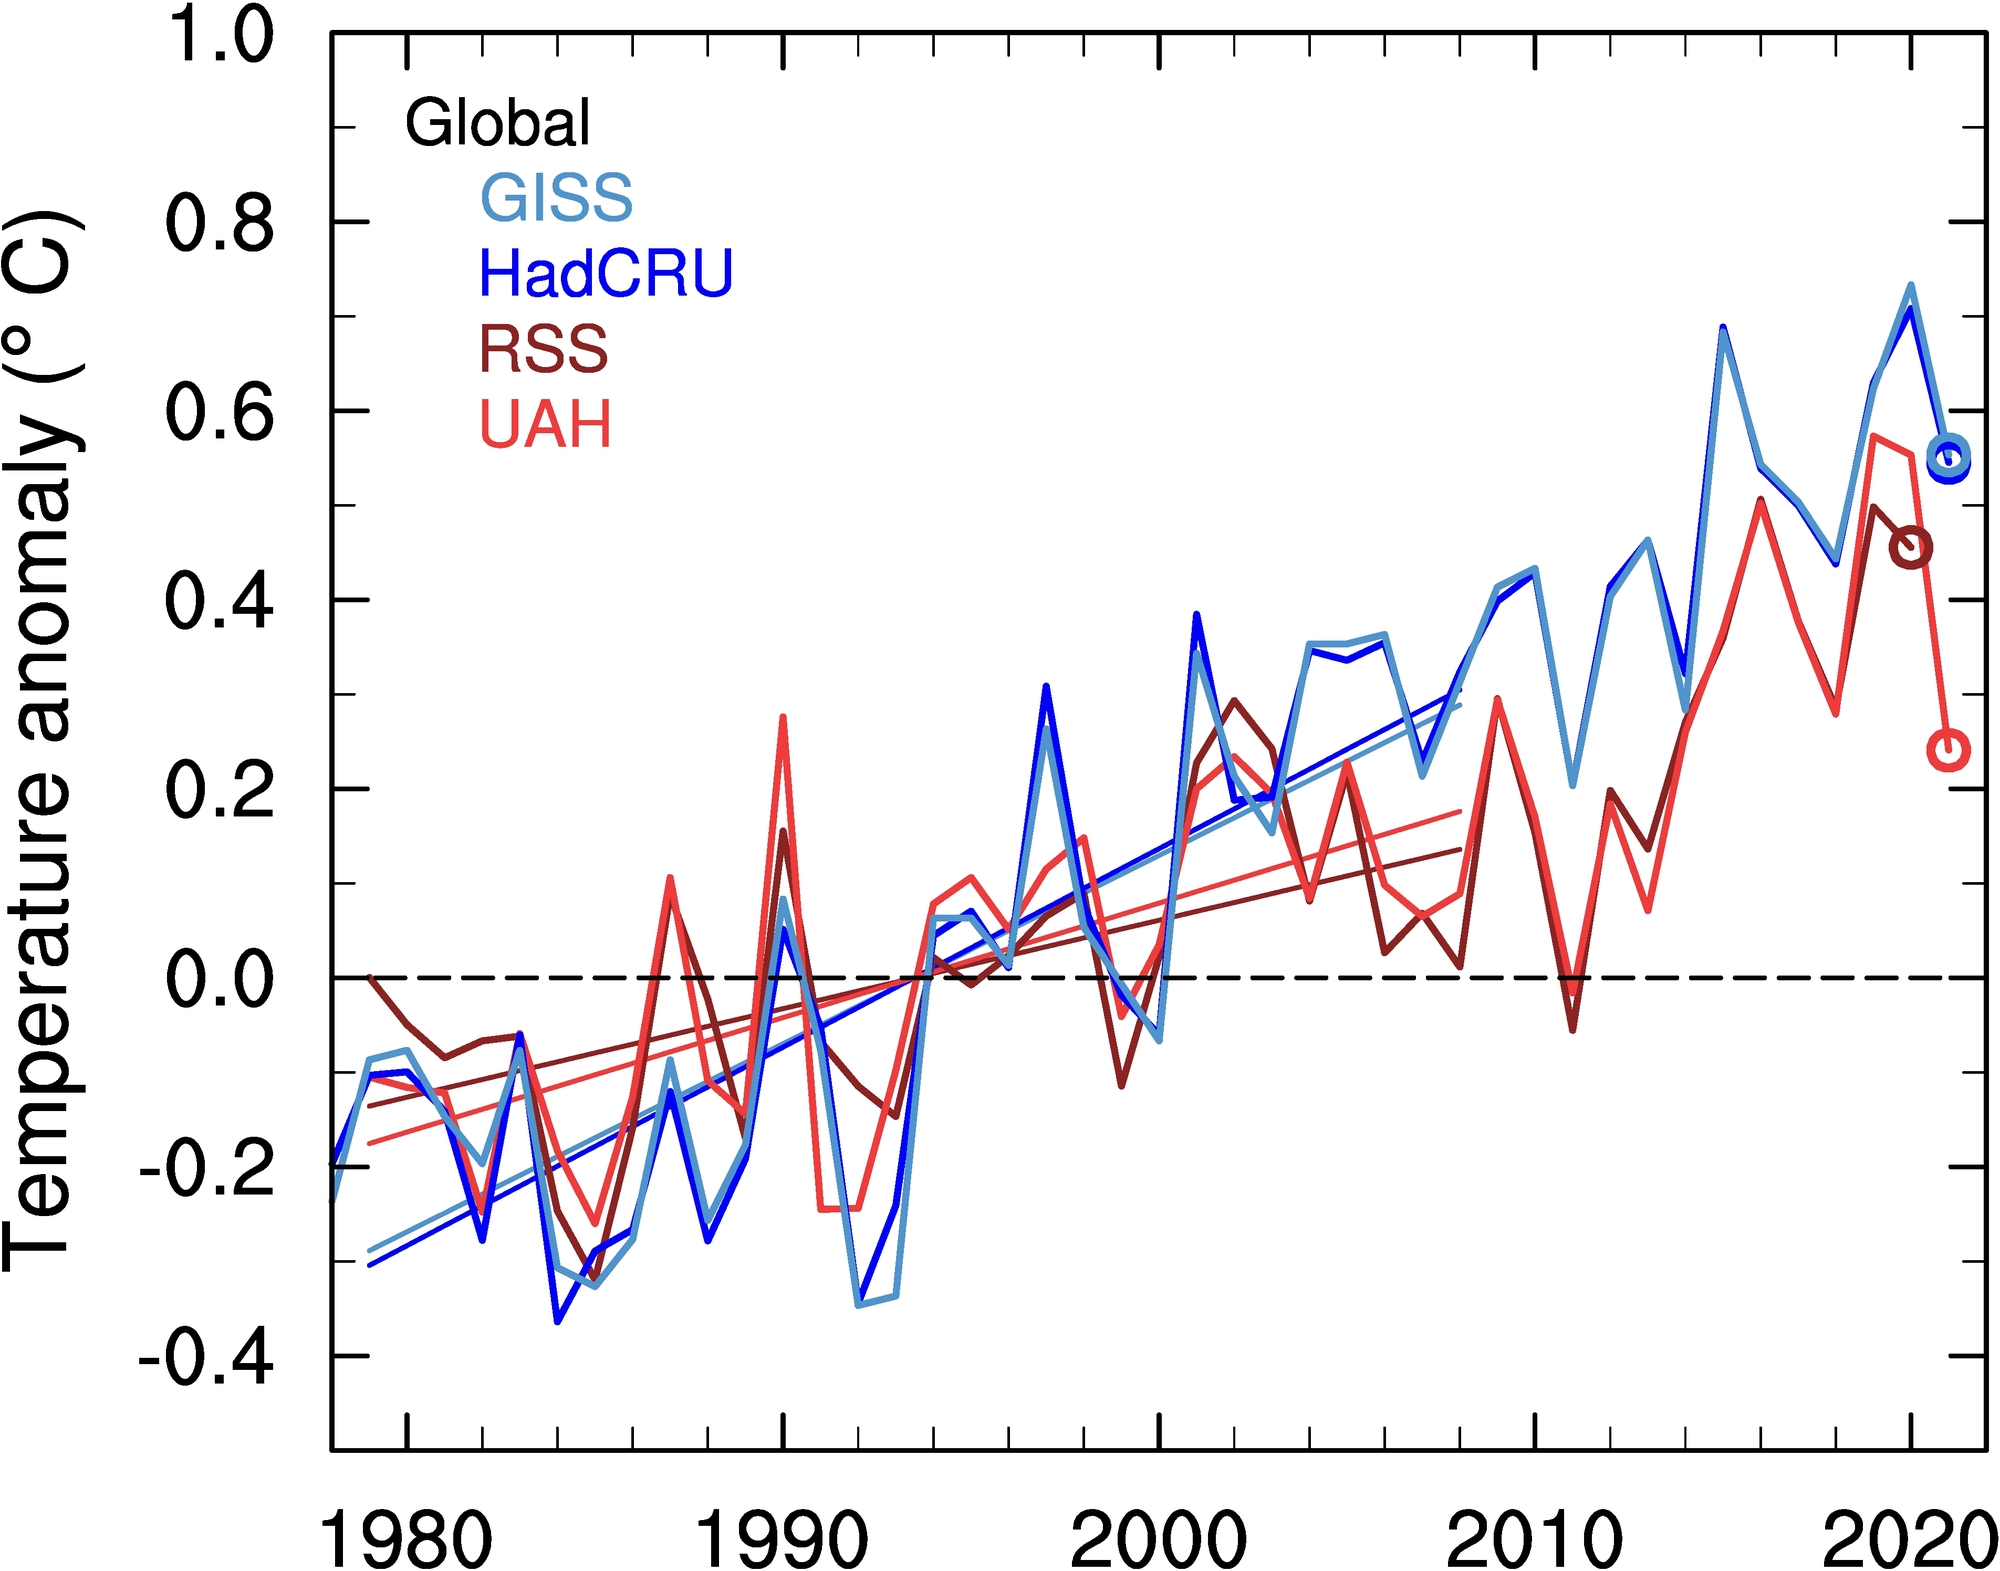
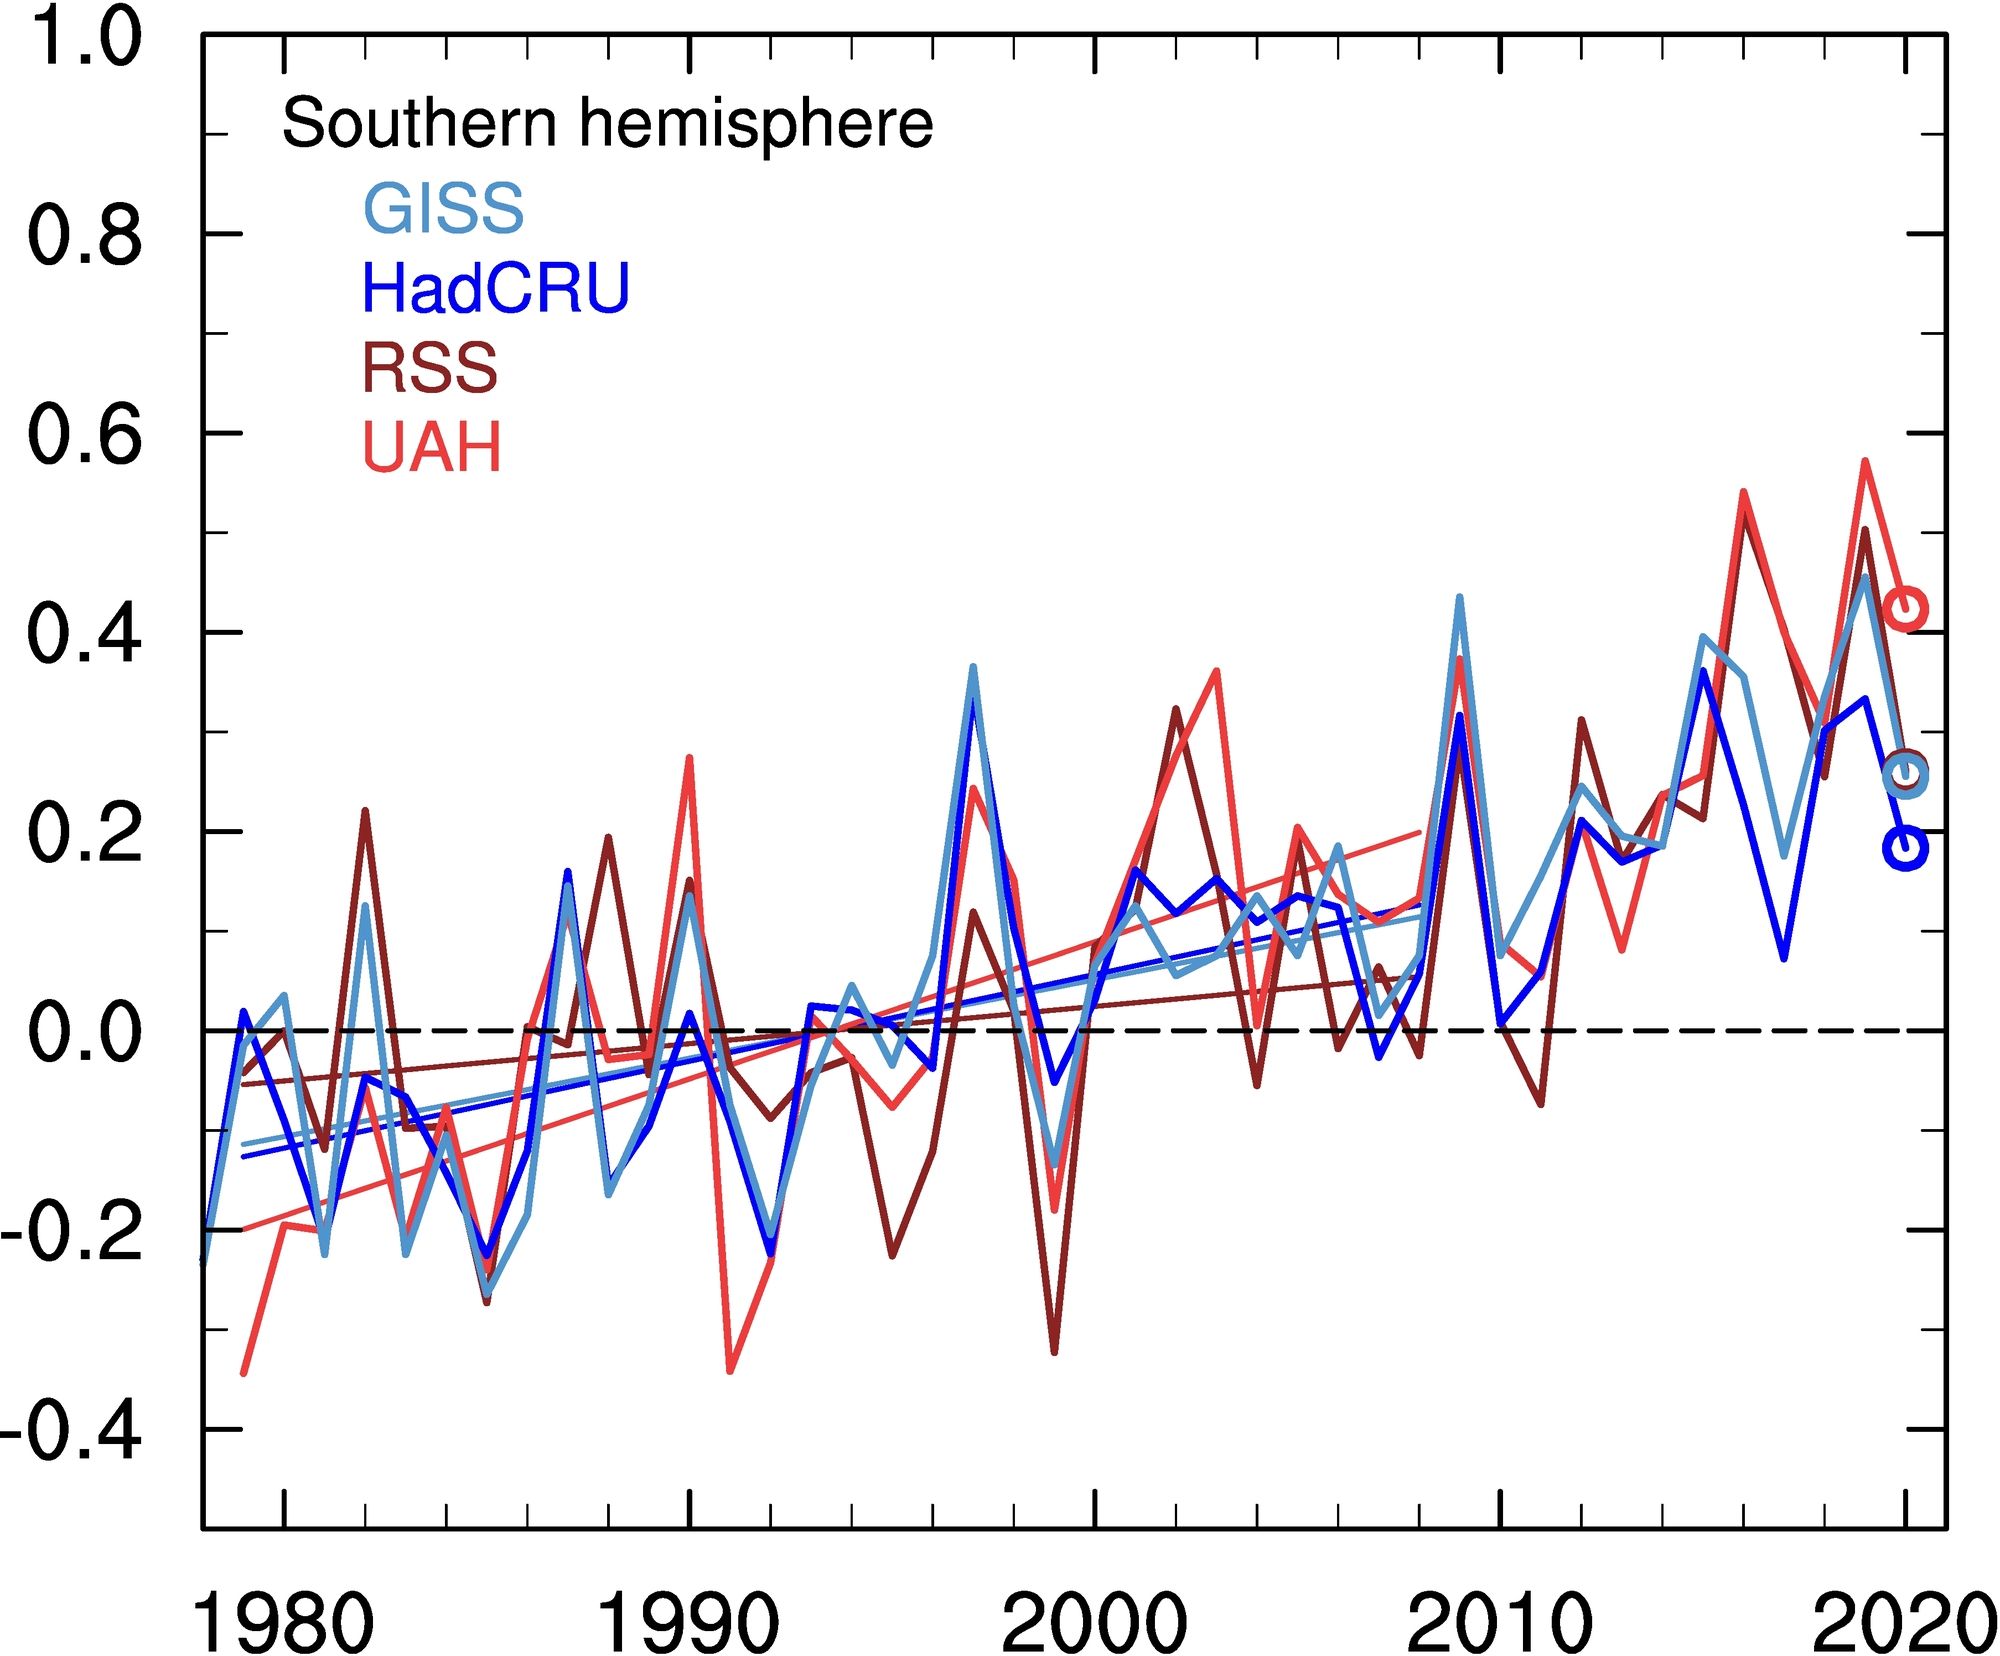
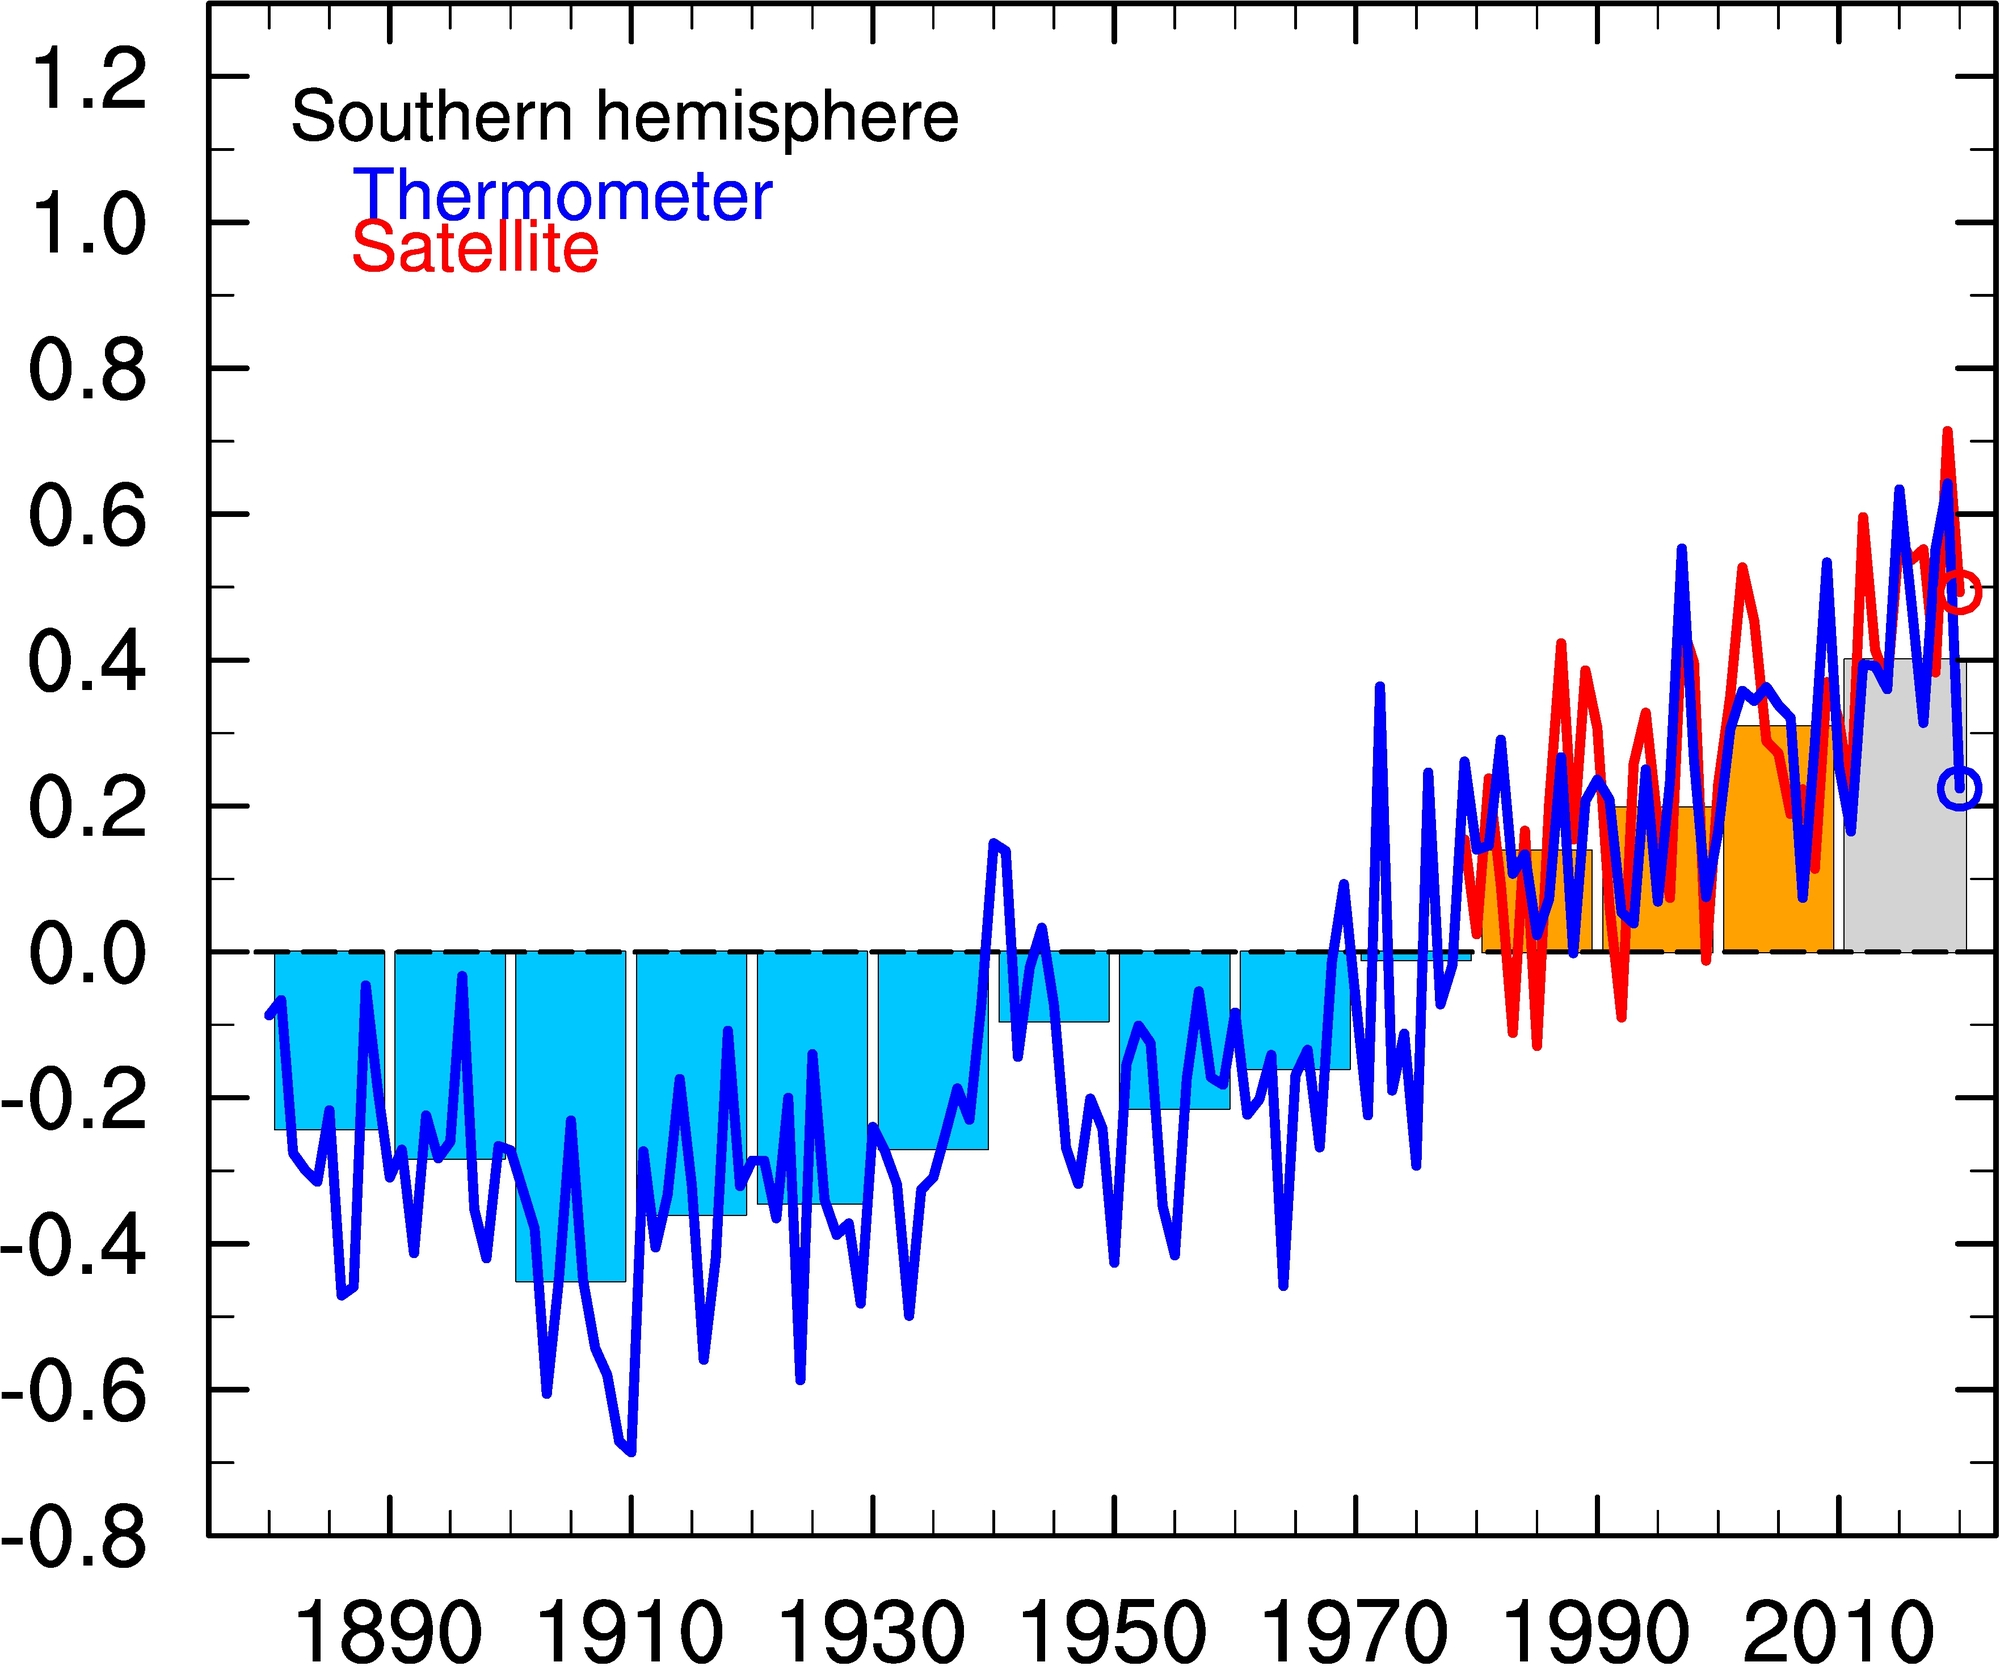
Observed annual mean temperature since 1880
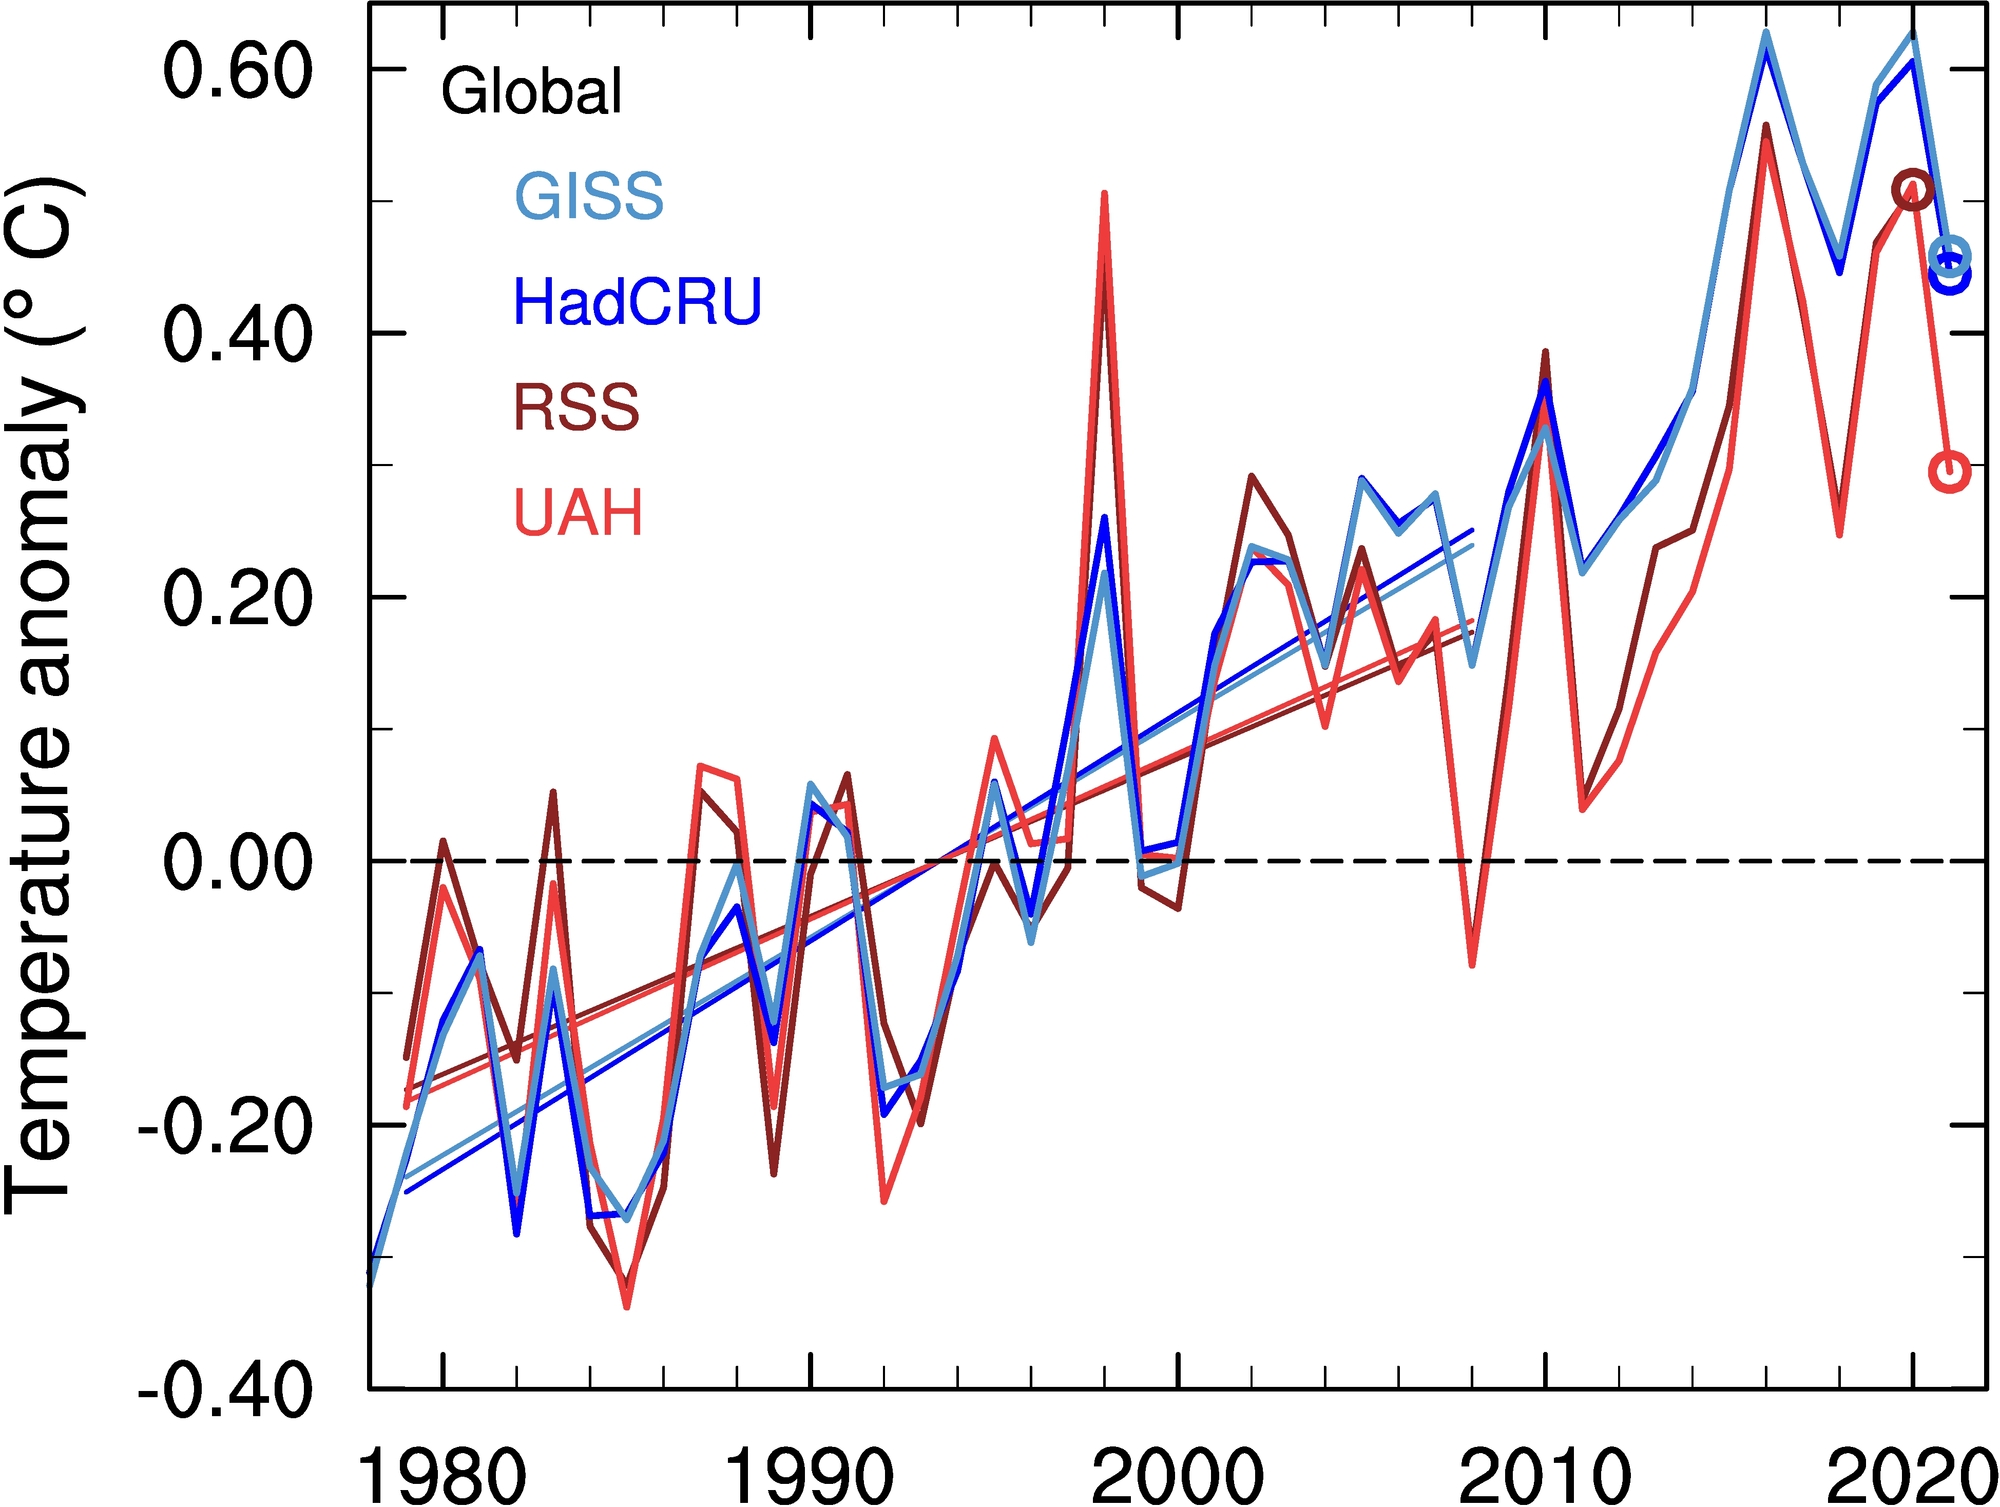
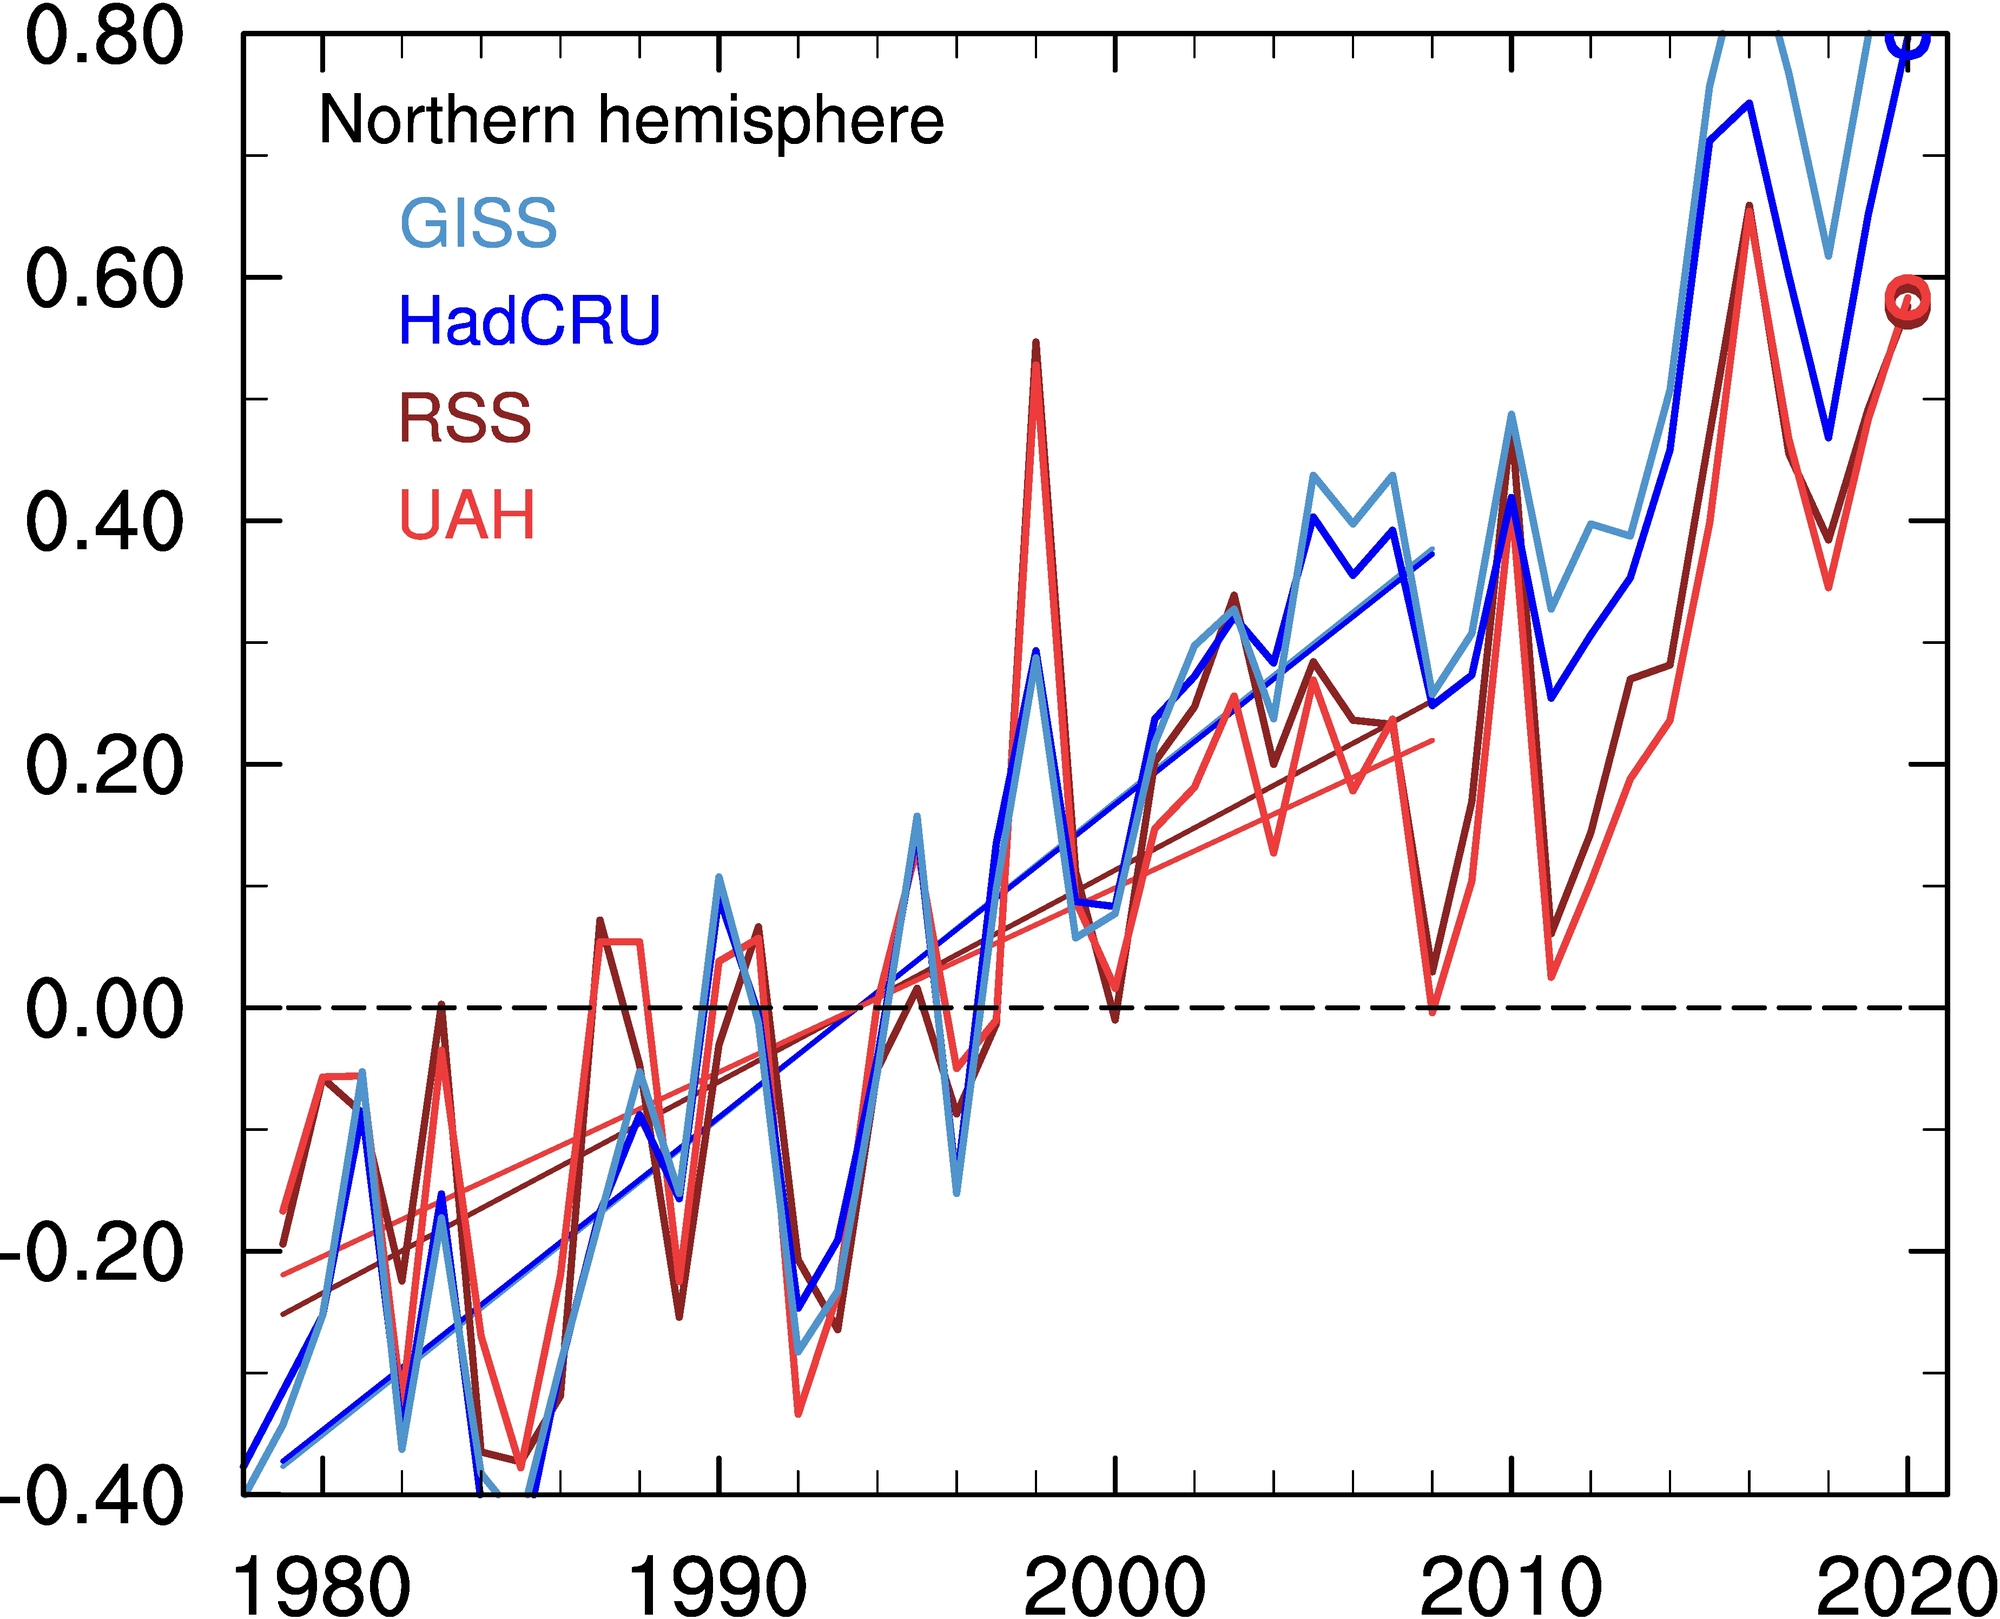
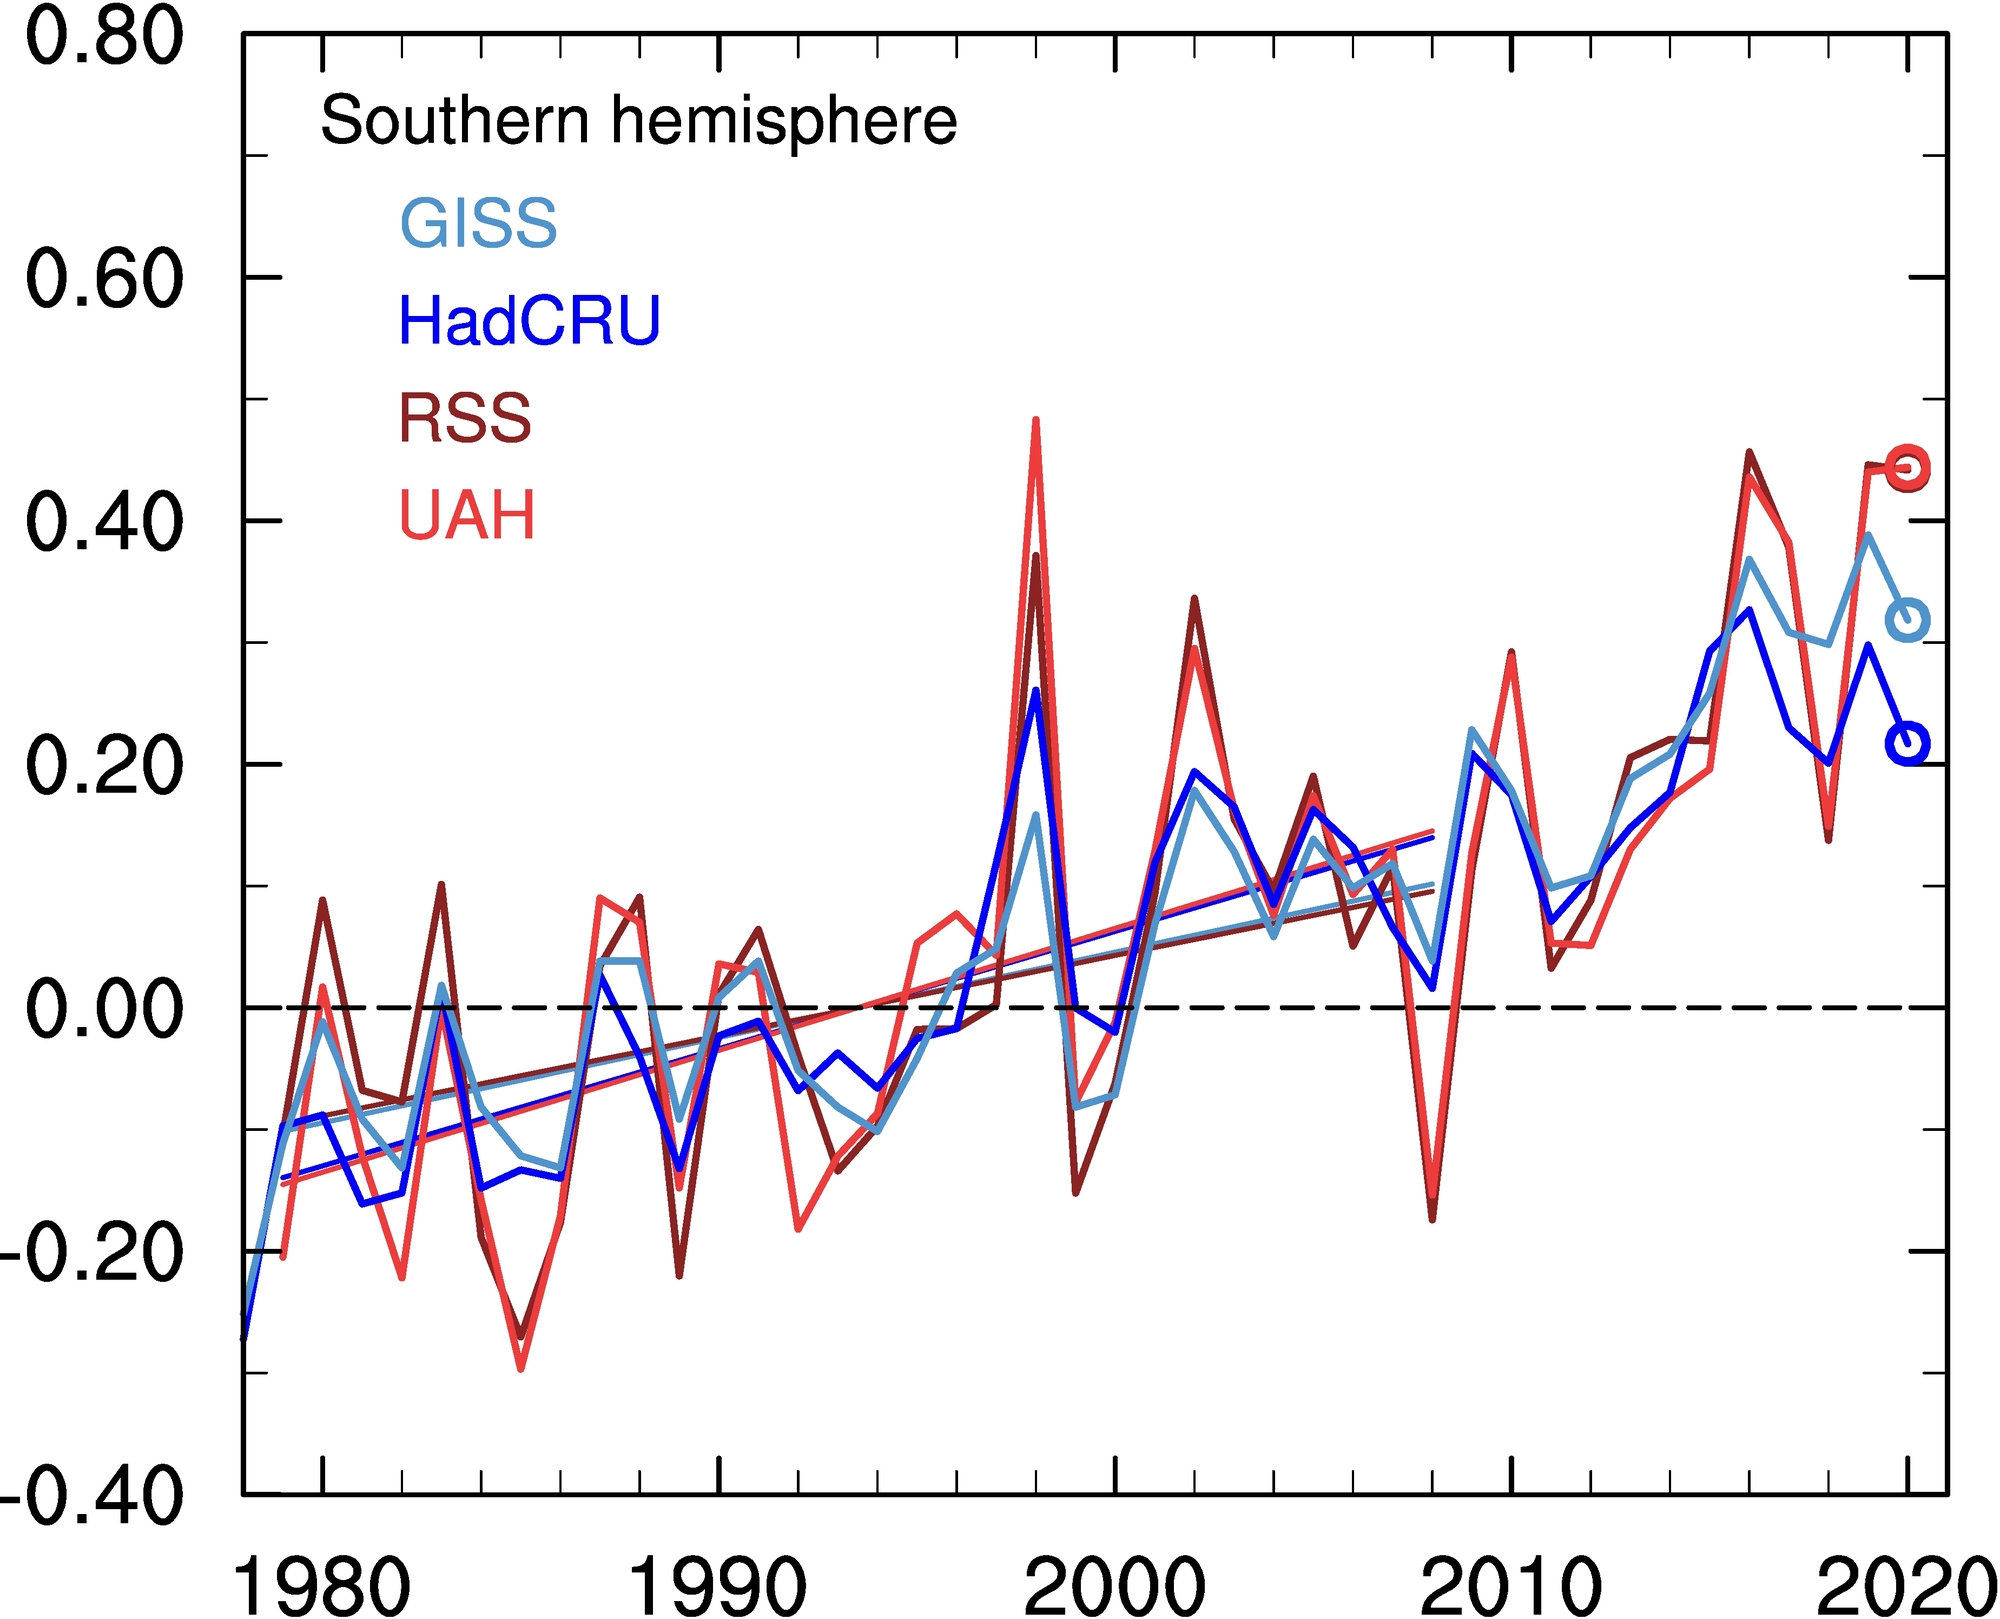
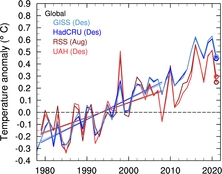
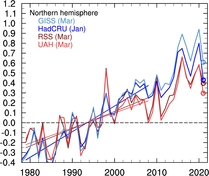
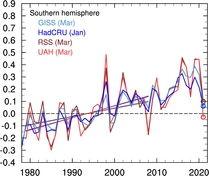
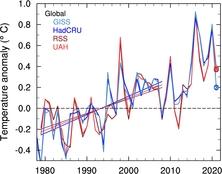
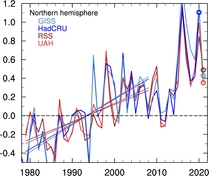
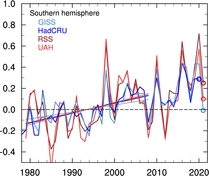
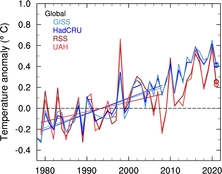
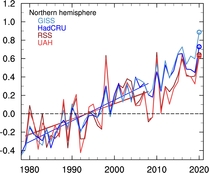
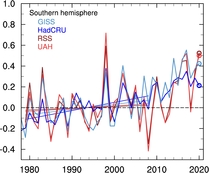
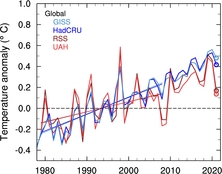
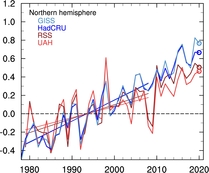
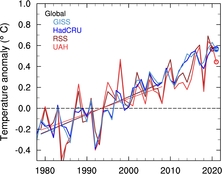
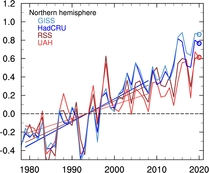
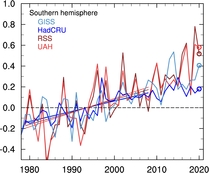
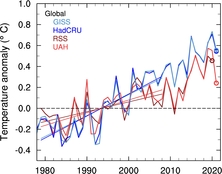
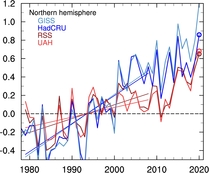
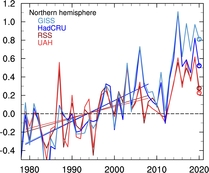
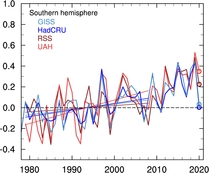
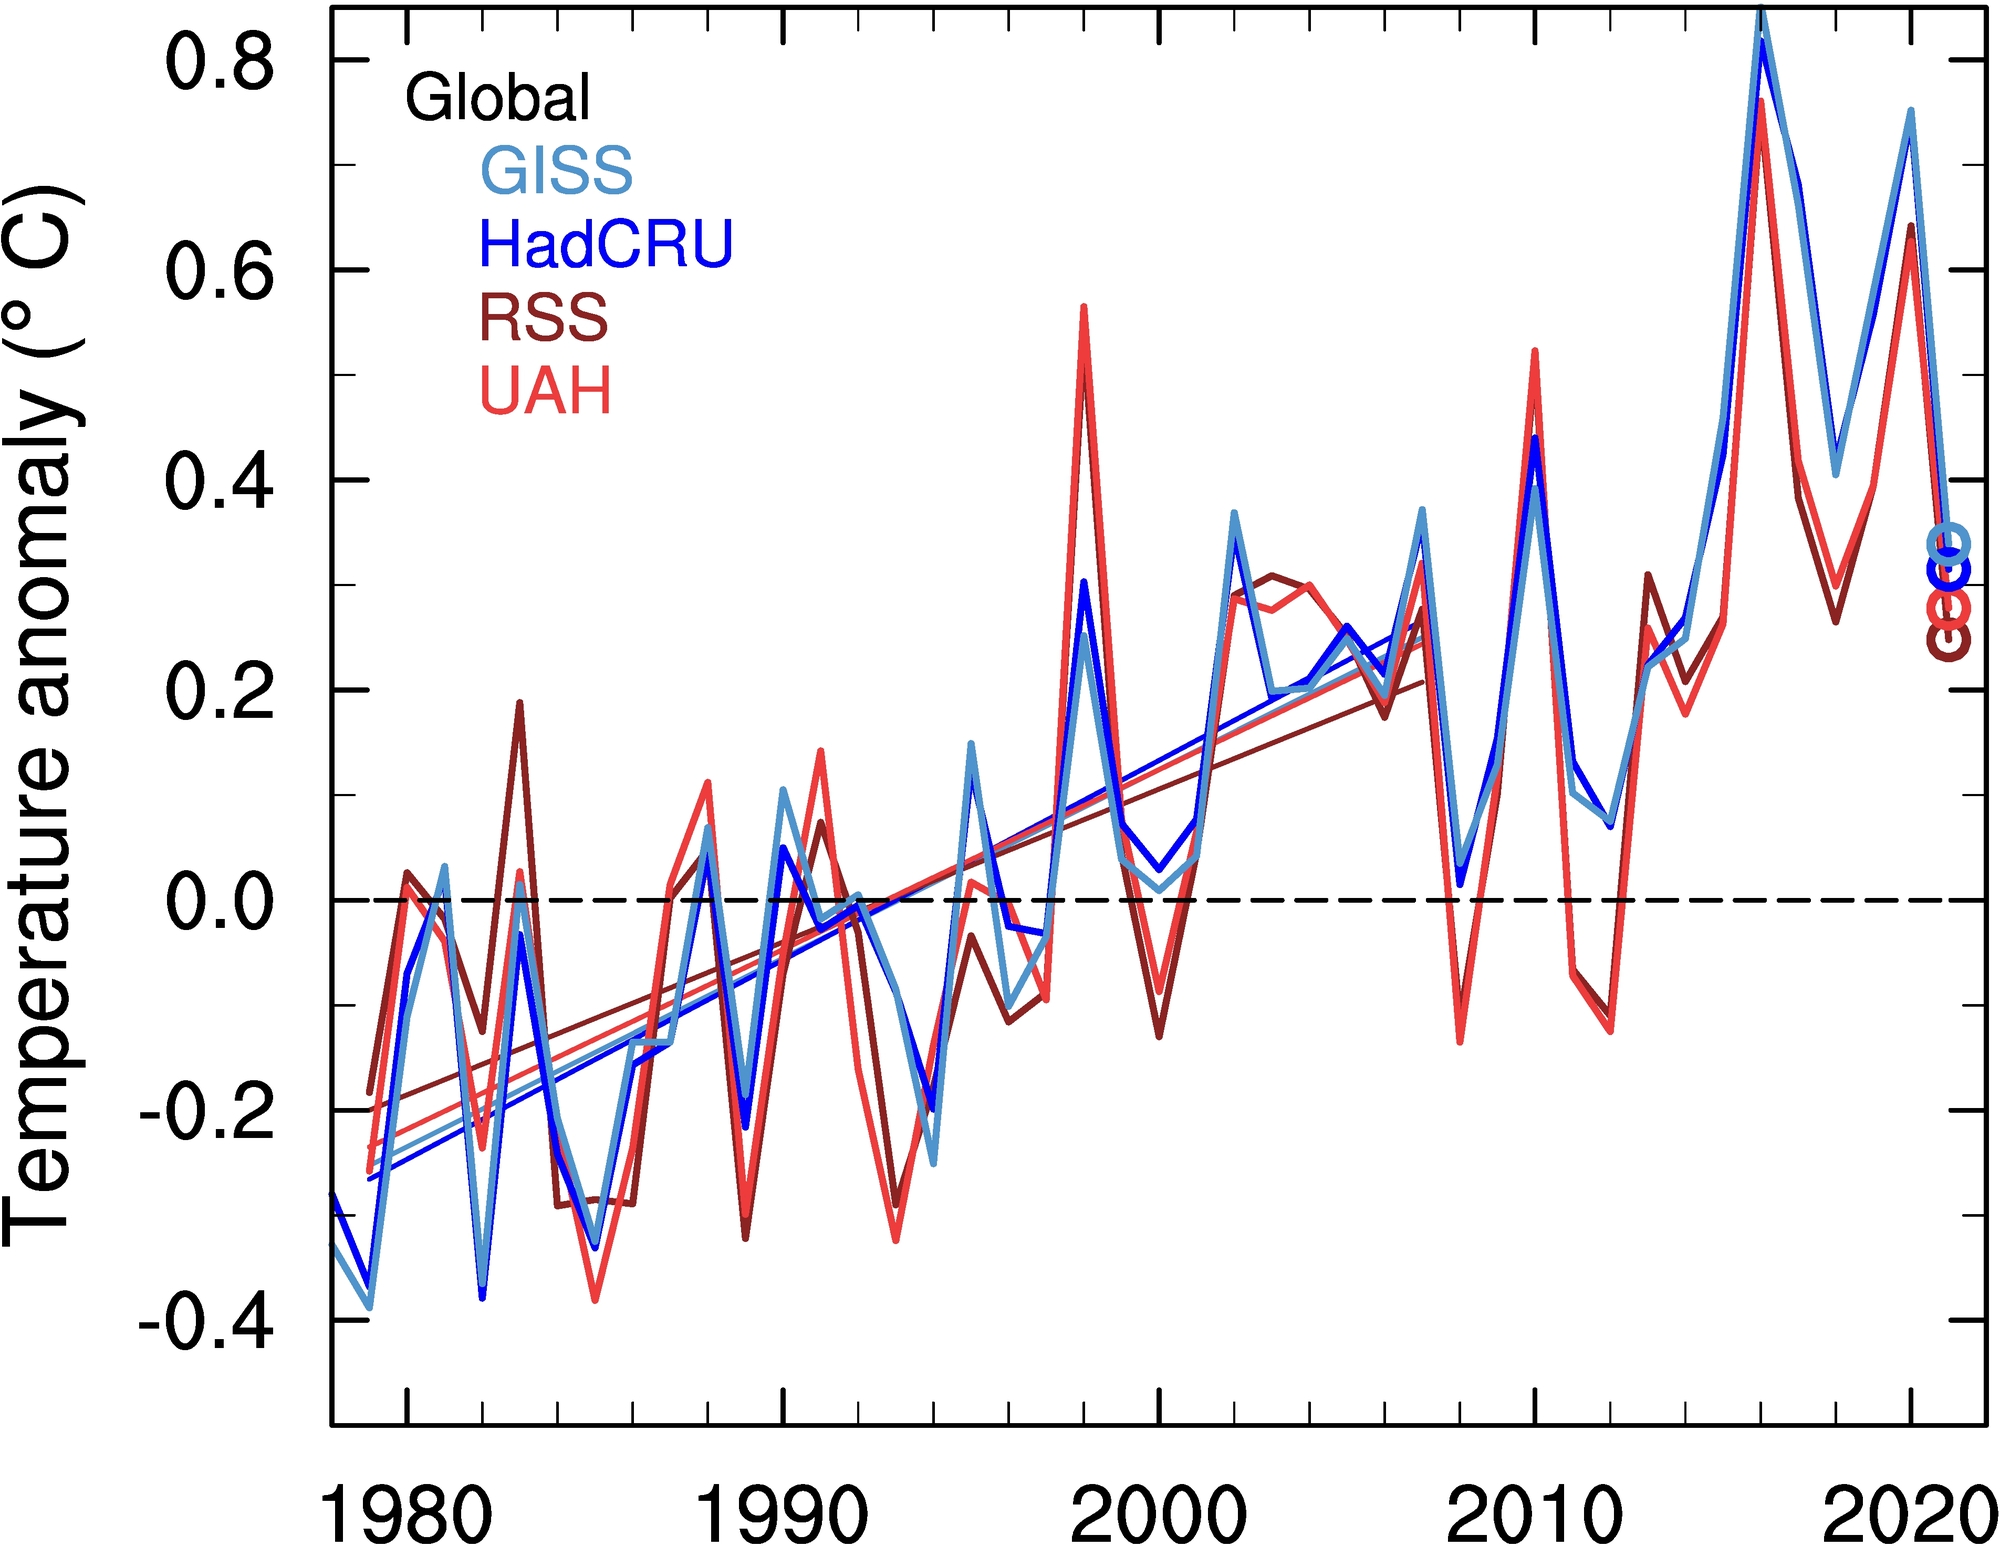
Annual mean global and hemispheric temperature time series for January-December relative to the 1961-1990 mean temperature.
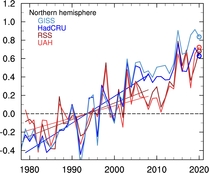
Analysis of surface thermometer recordings in blue and satellite recordings from the lower 3-5 km of the atmosphere from satellite in red.
The bars show decadal mean temperature based on the thermometer analysis (blue curve). The mean temperature of the surface and satellite records overlap during 1979-2008; the first 30-year time period covered by both recordings.
Recenmost year marked by circles.

Data.
Animation of the GISS data.
Note: Errors may occur since all figures are automatically updated with only sporadic checking.
Return to Temperature overview. Return to top of page.


