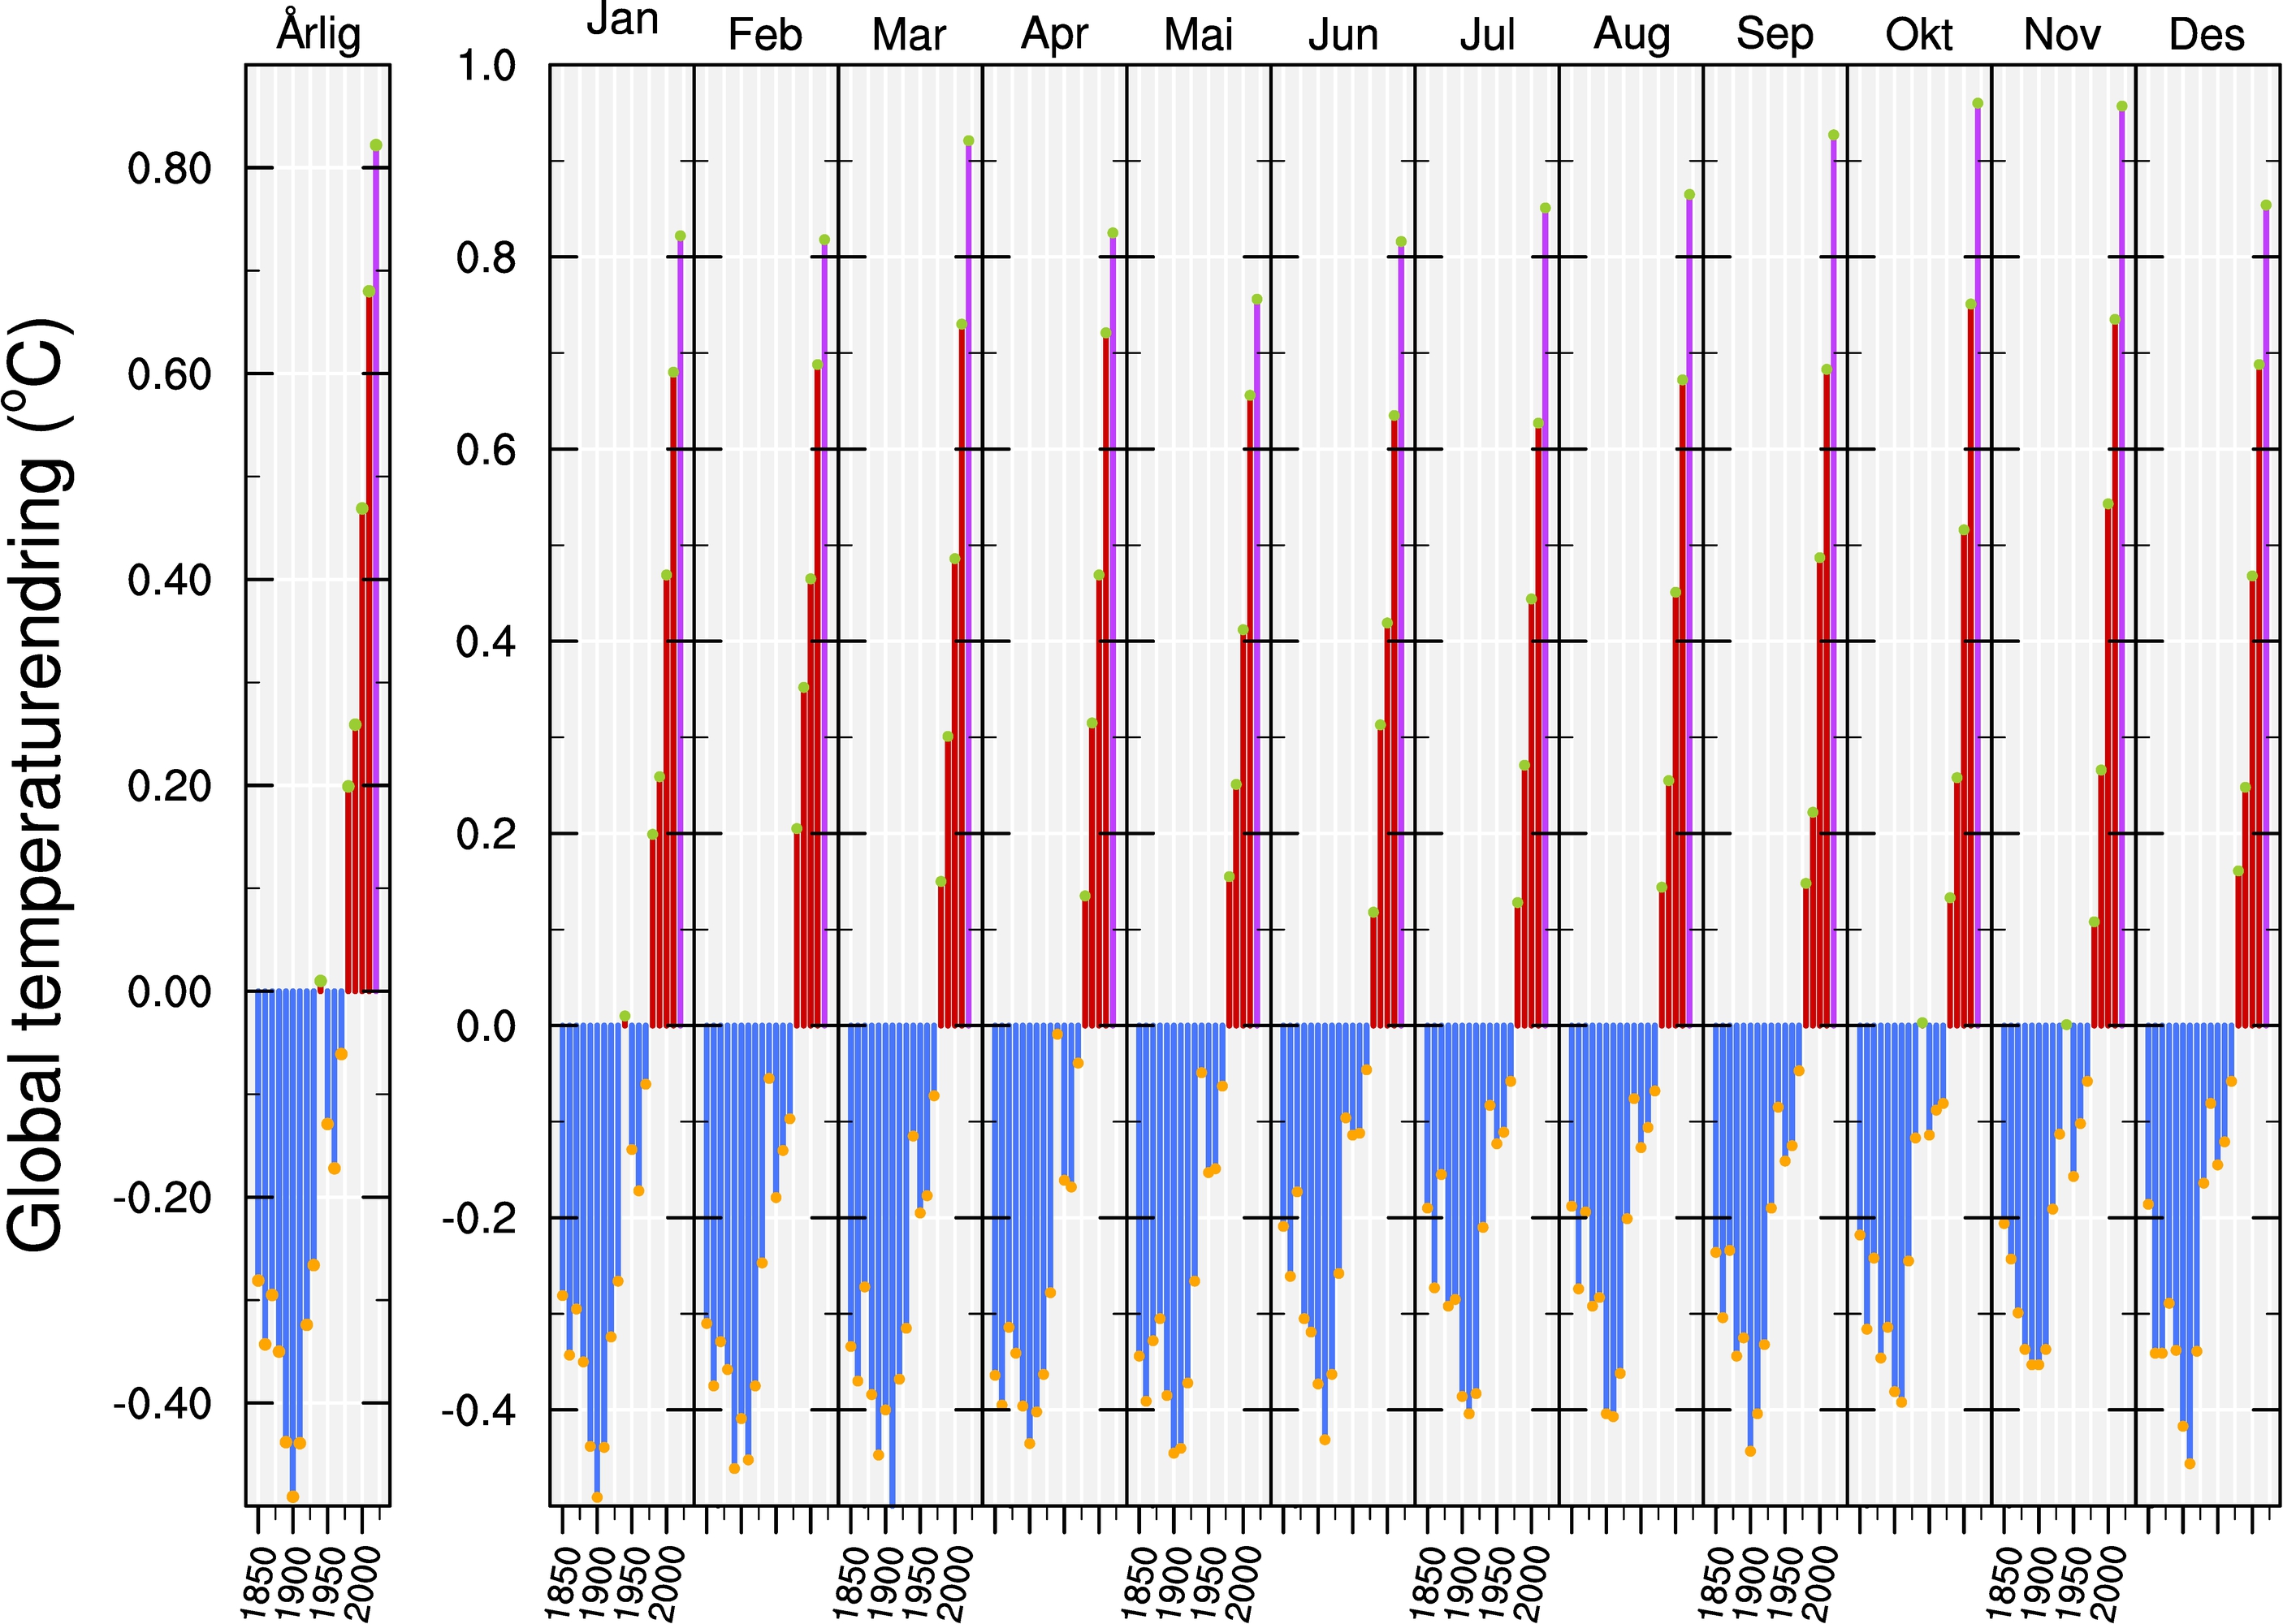
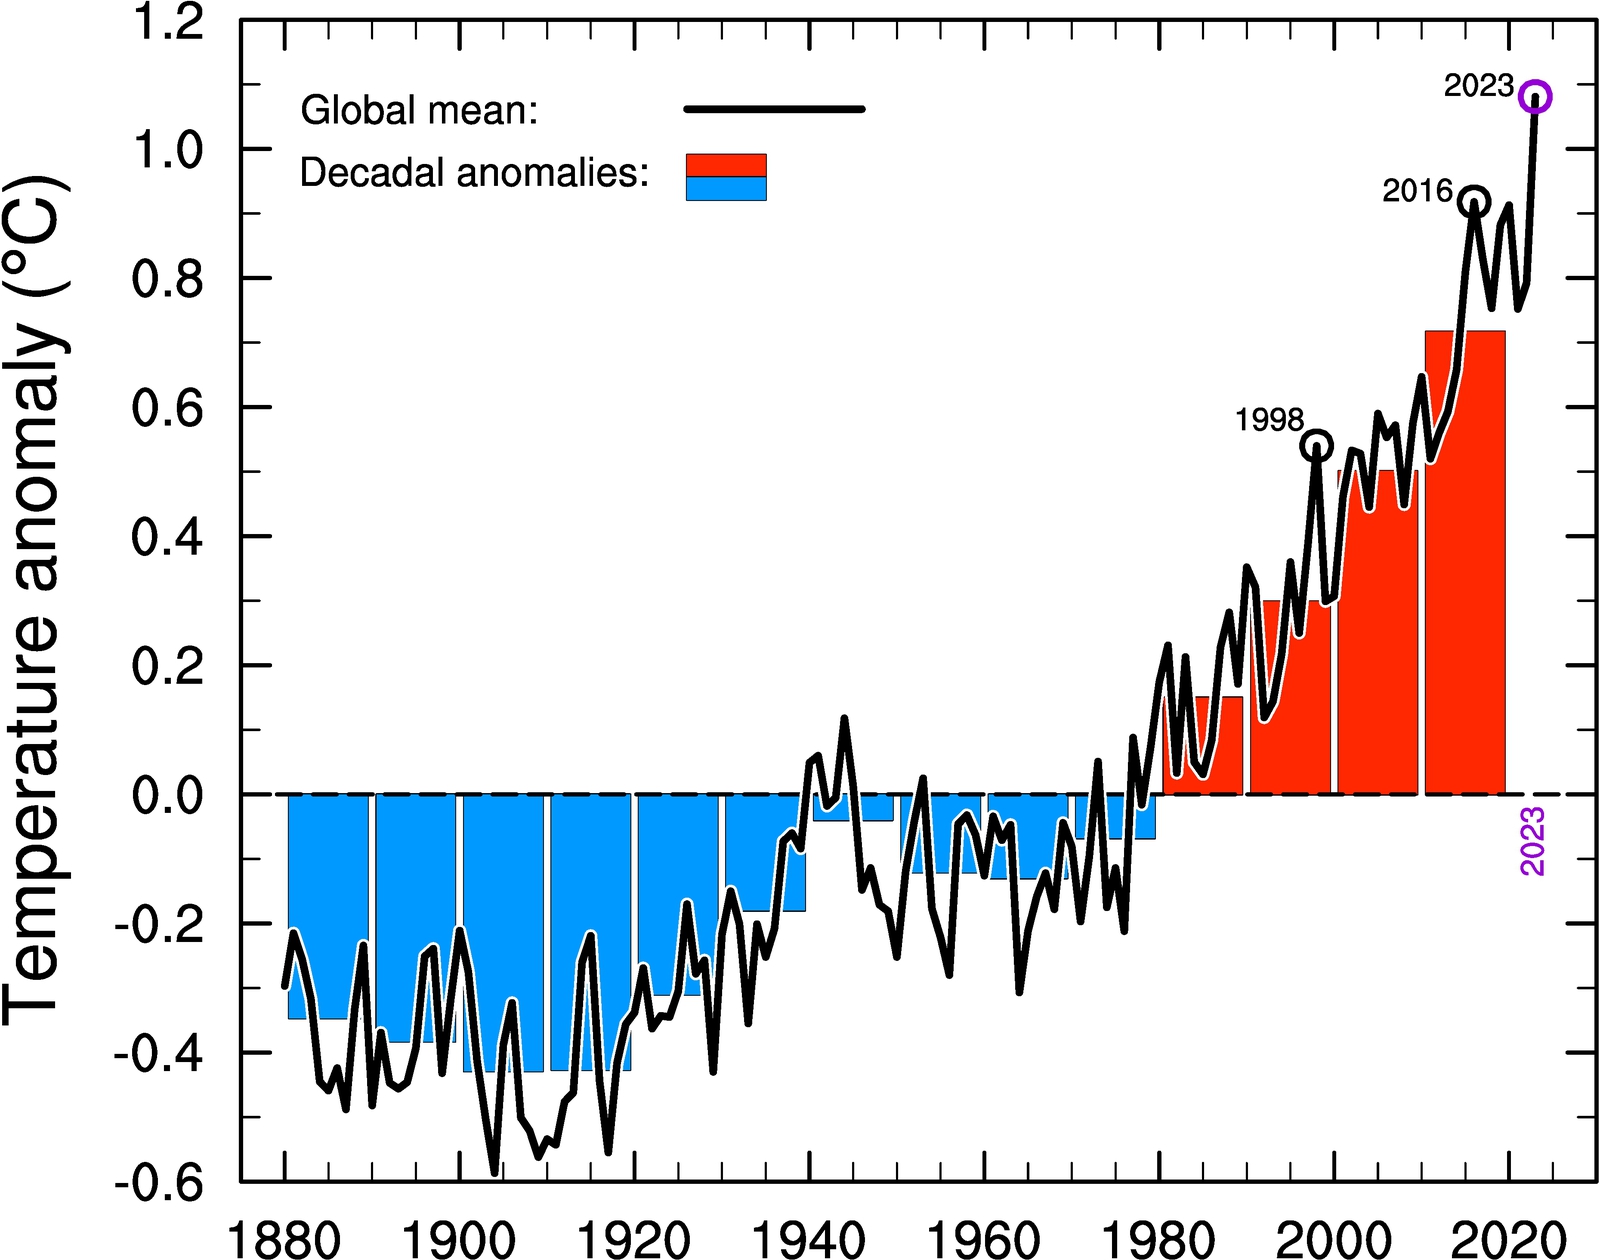
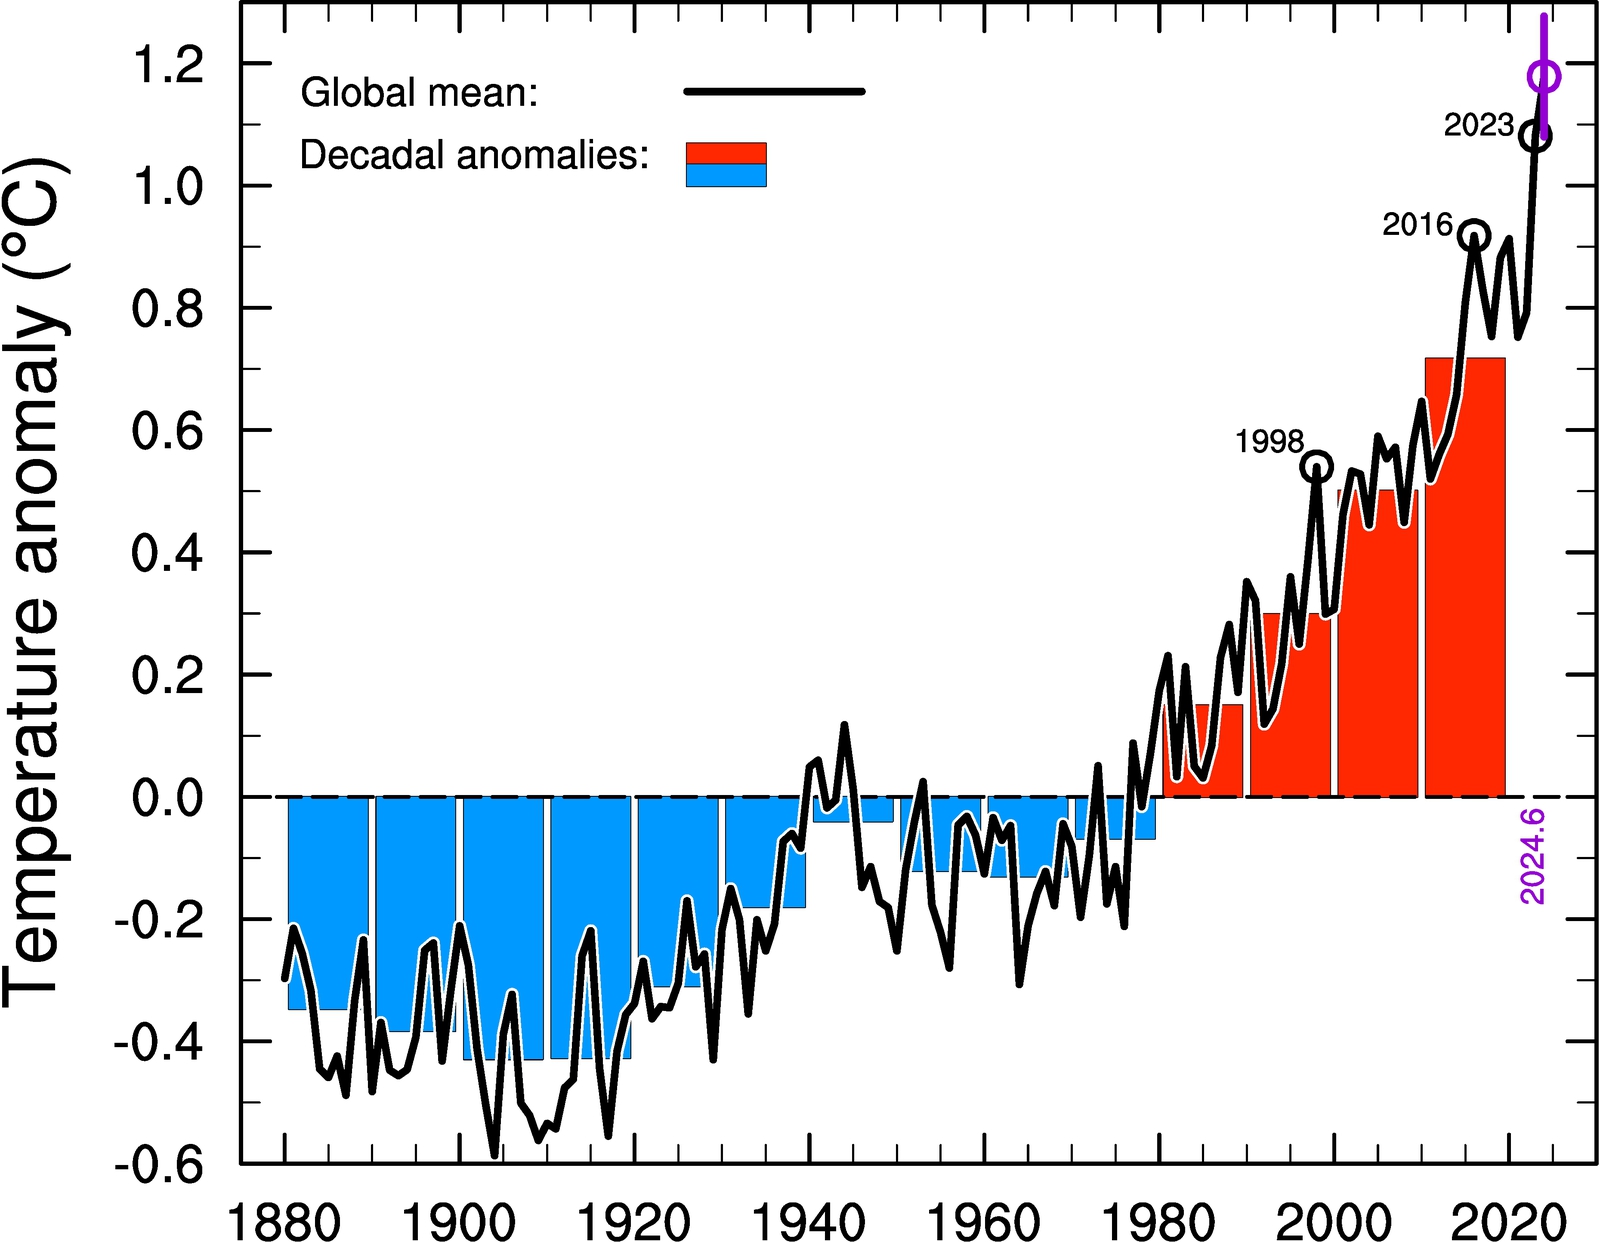
Observed annual mean temperature since 1880

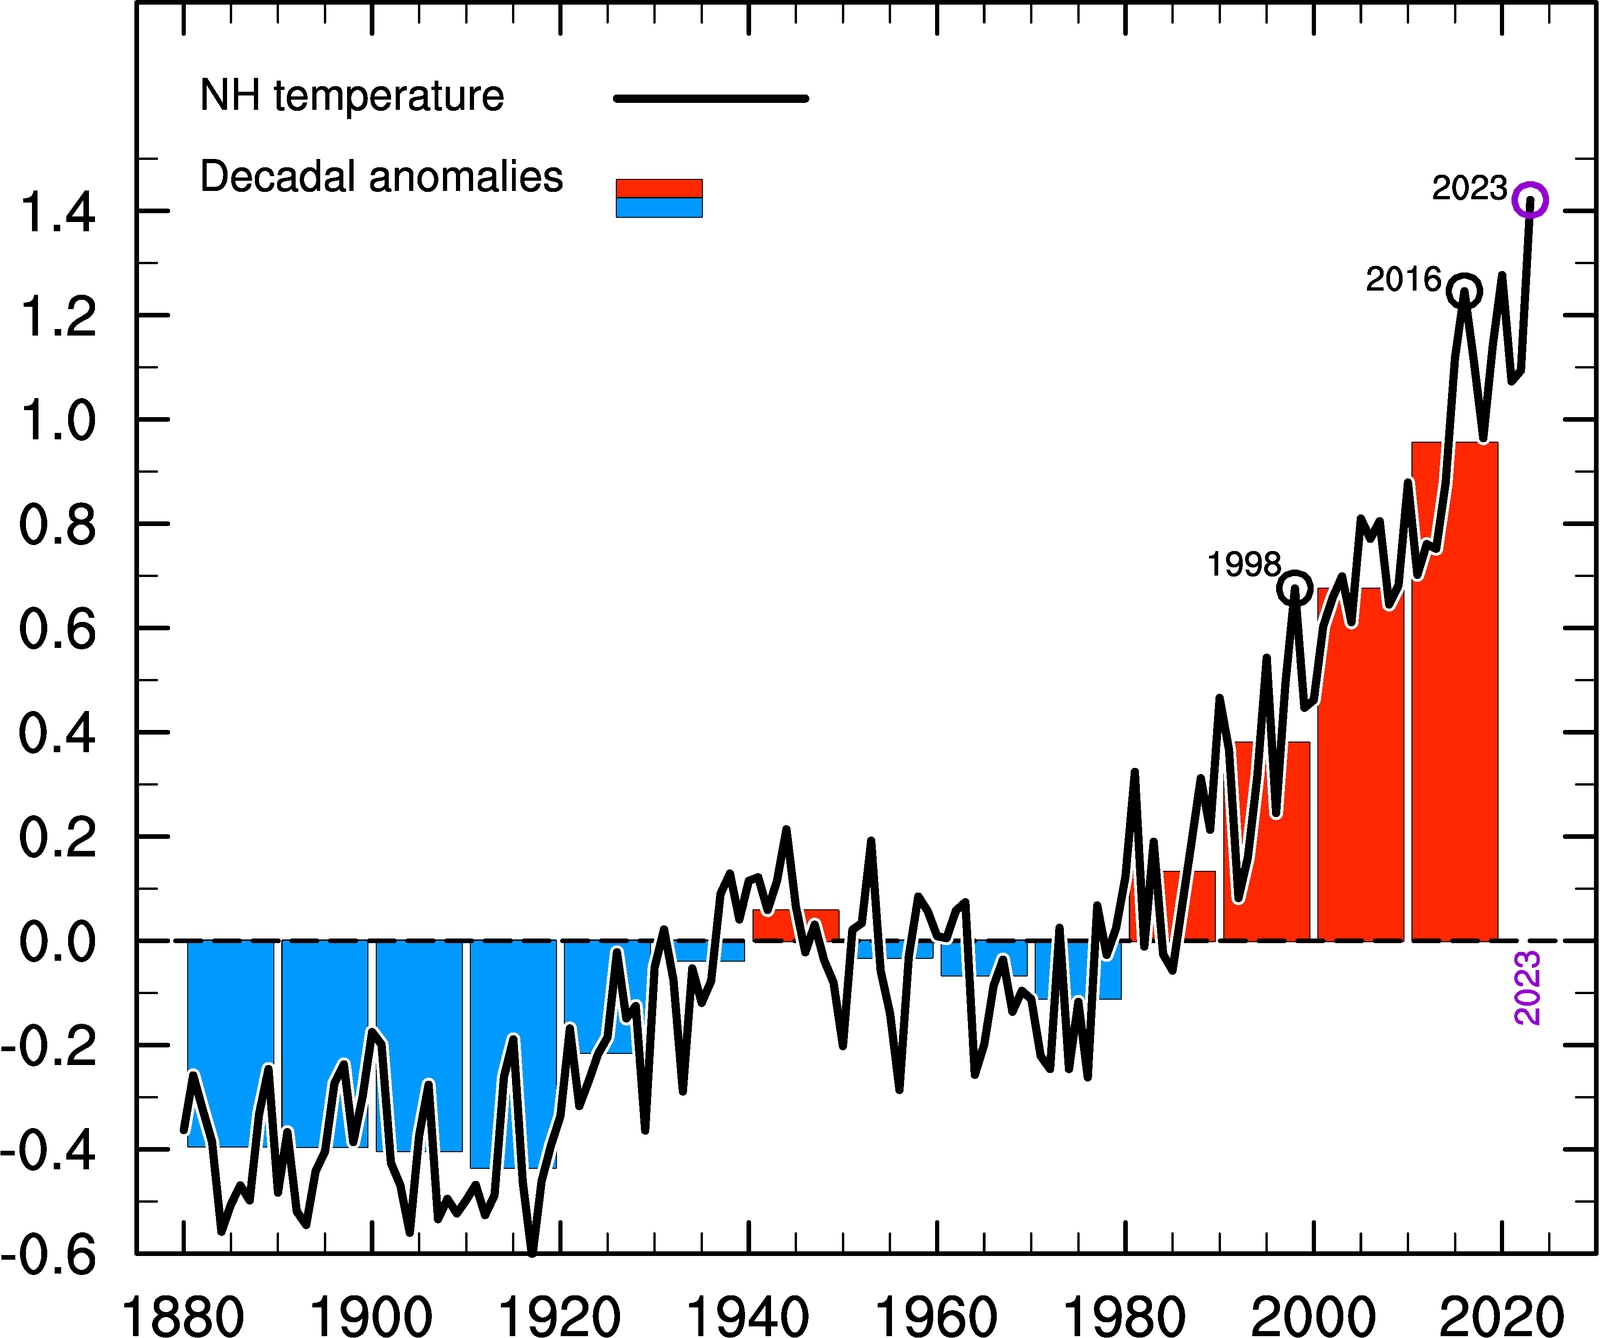
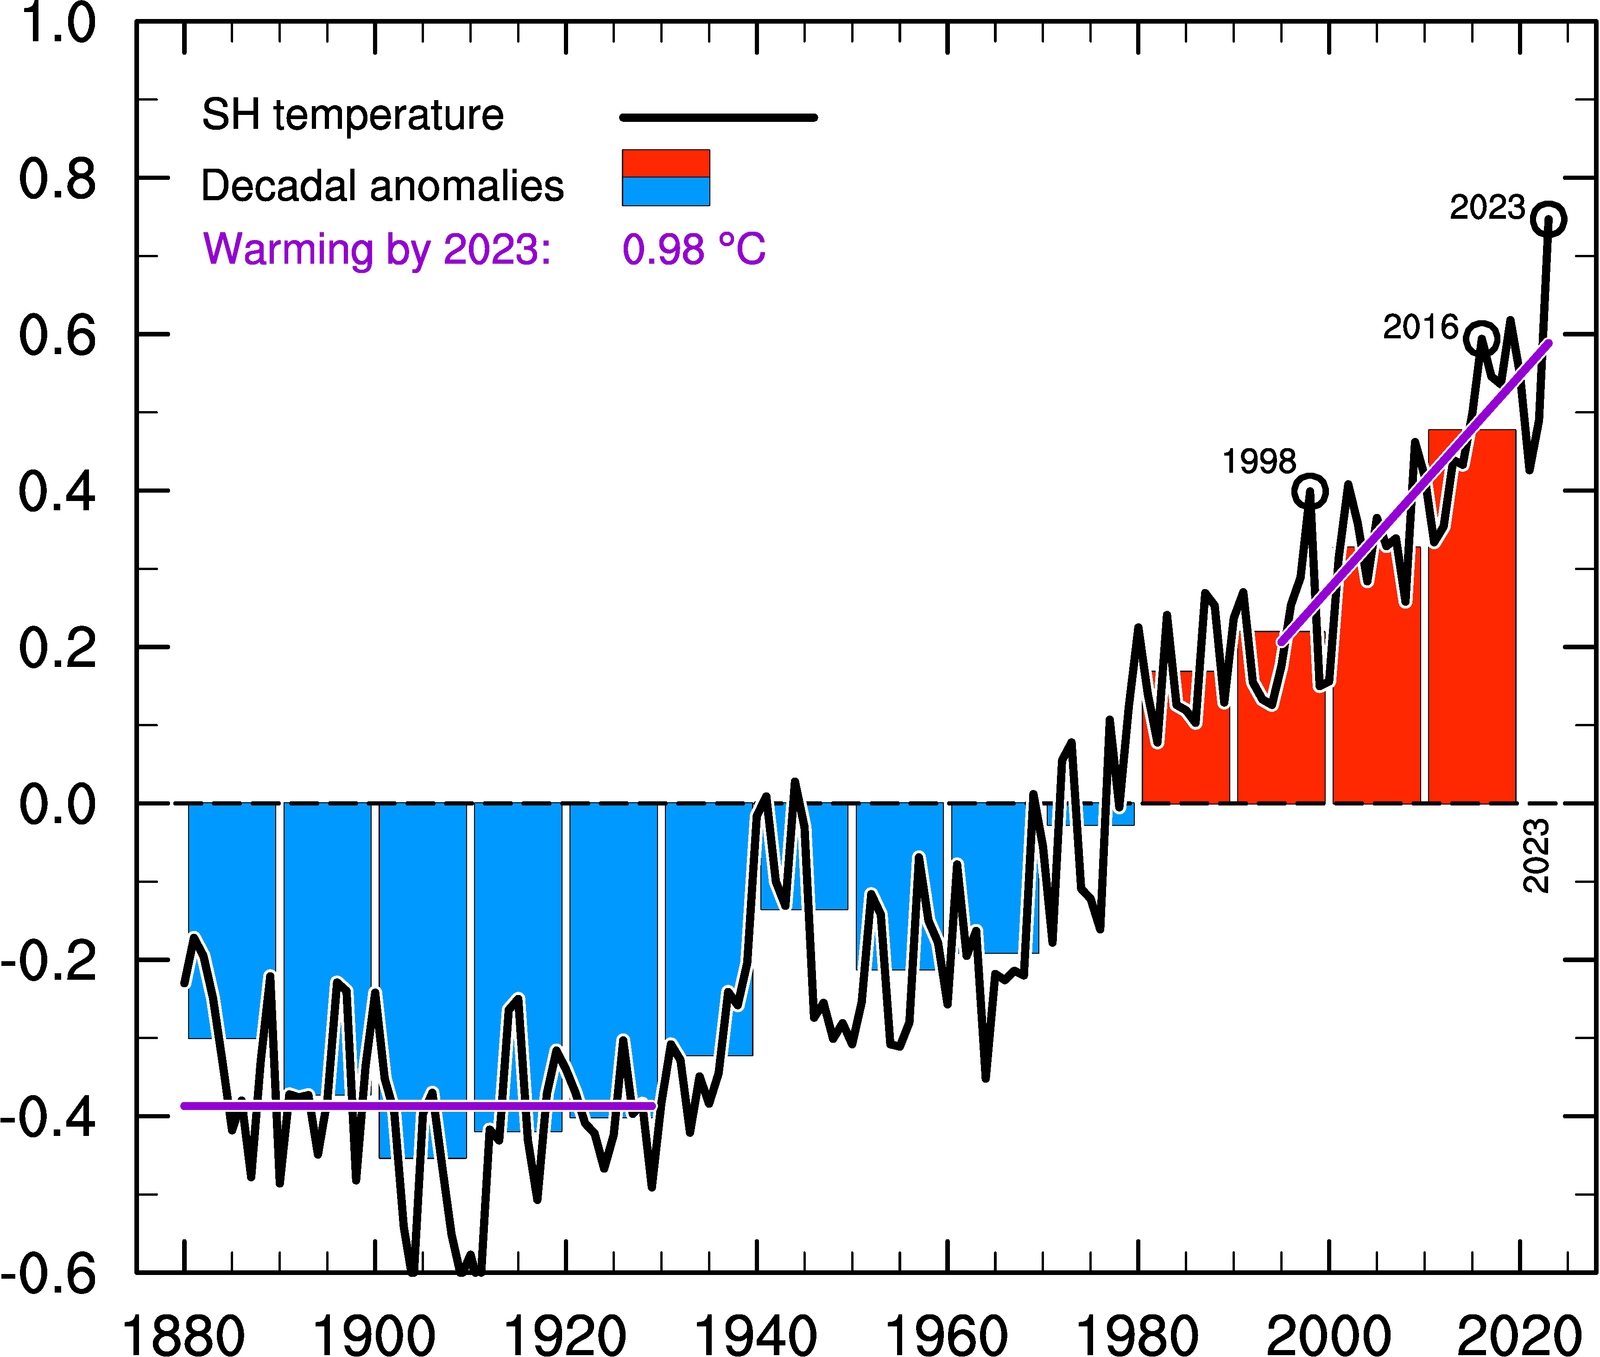
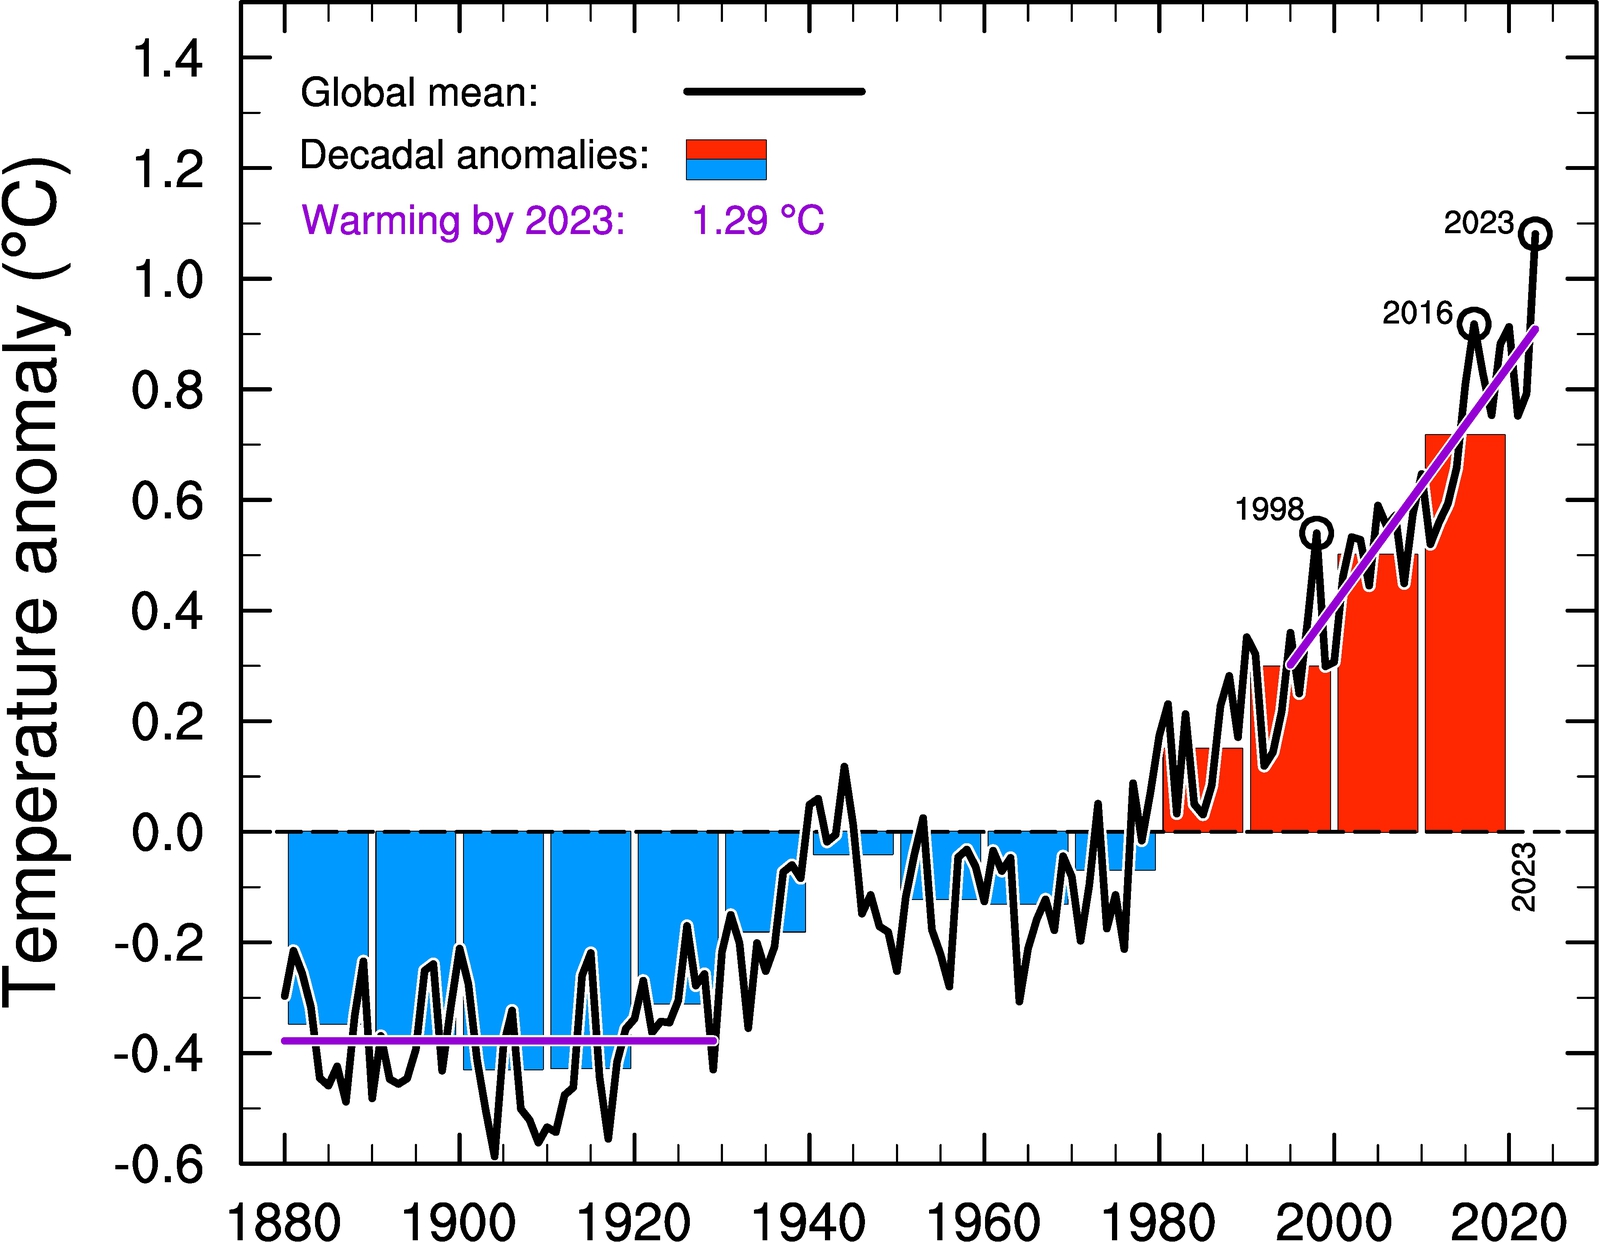
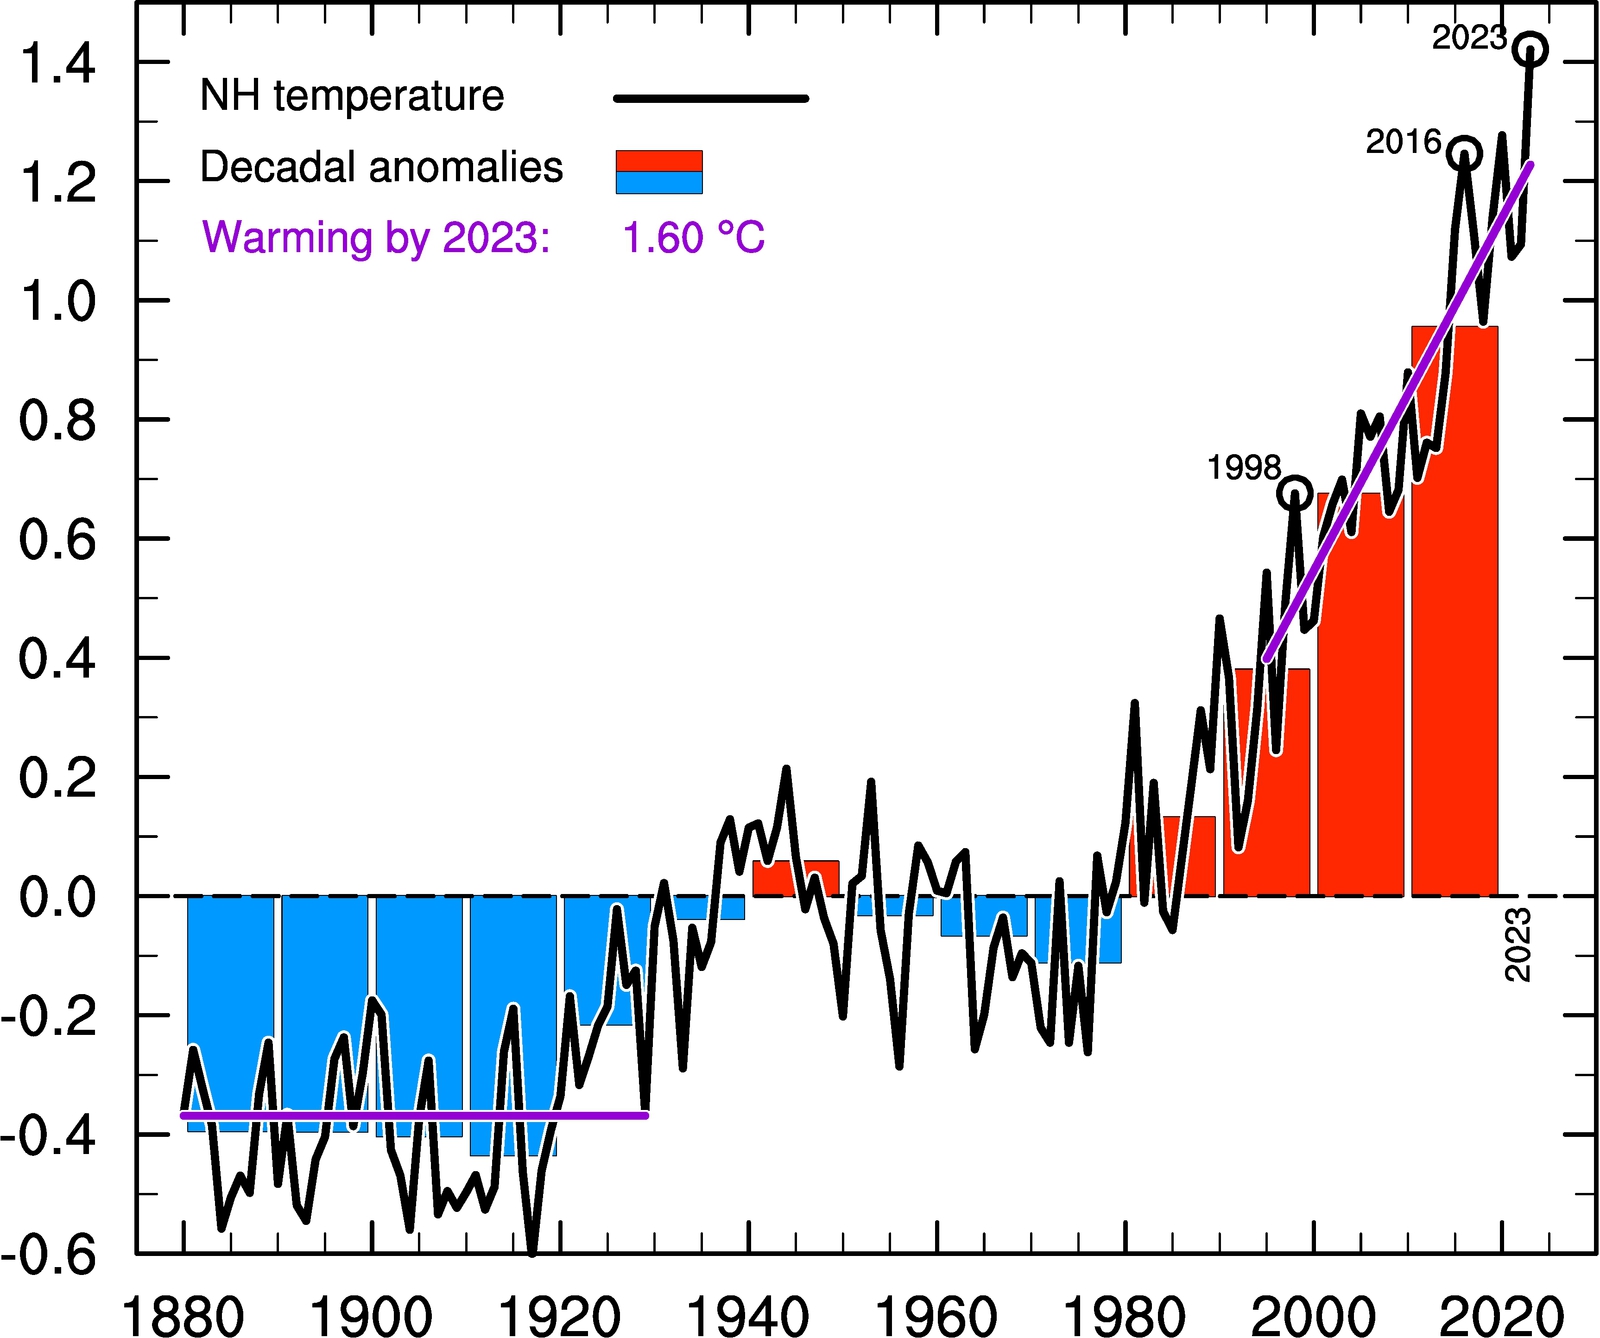
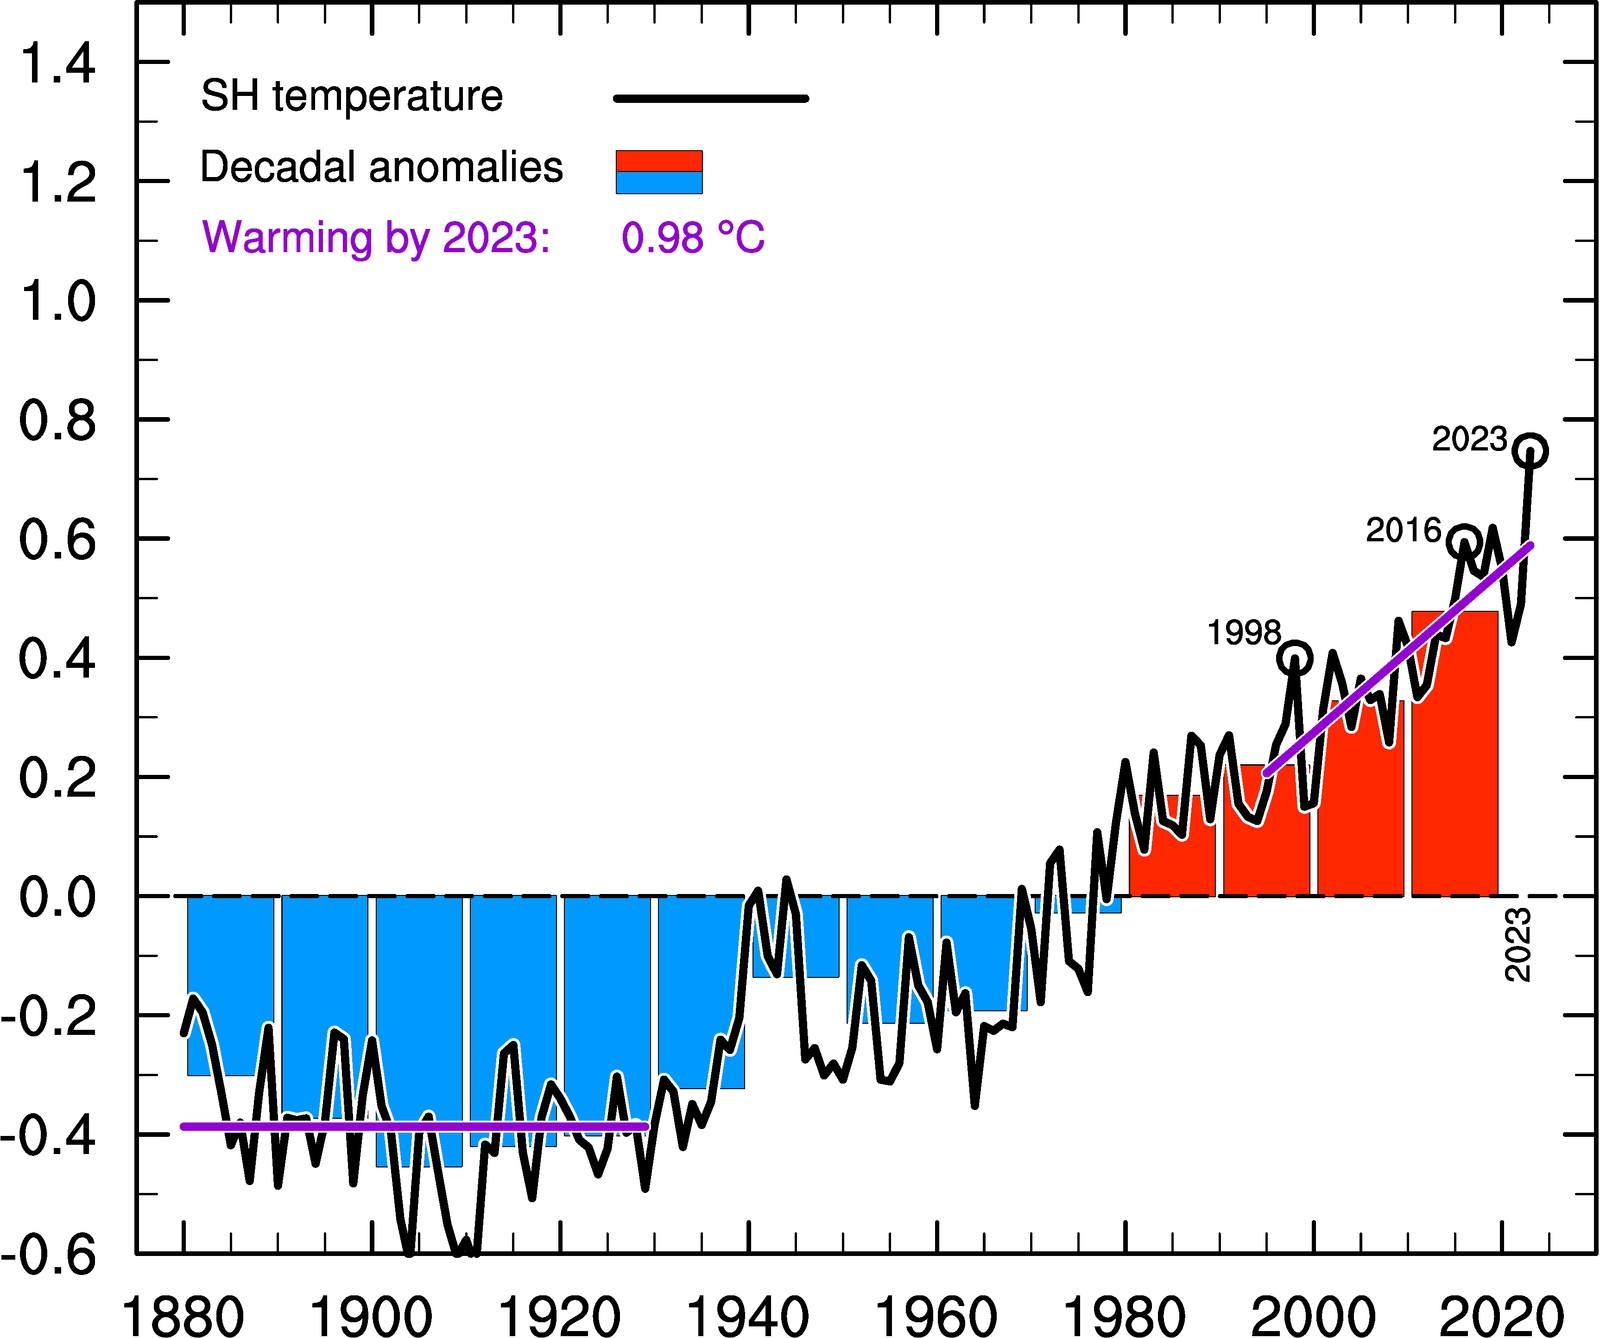
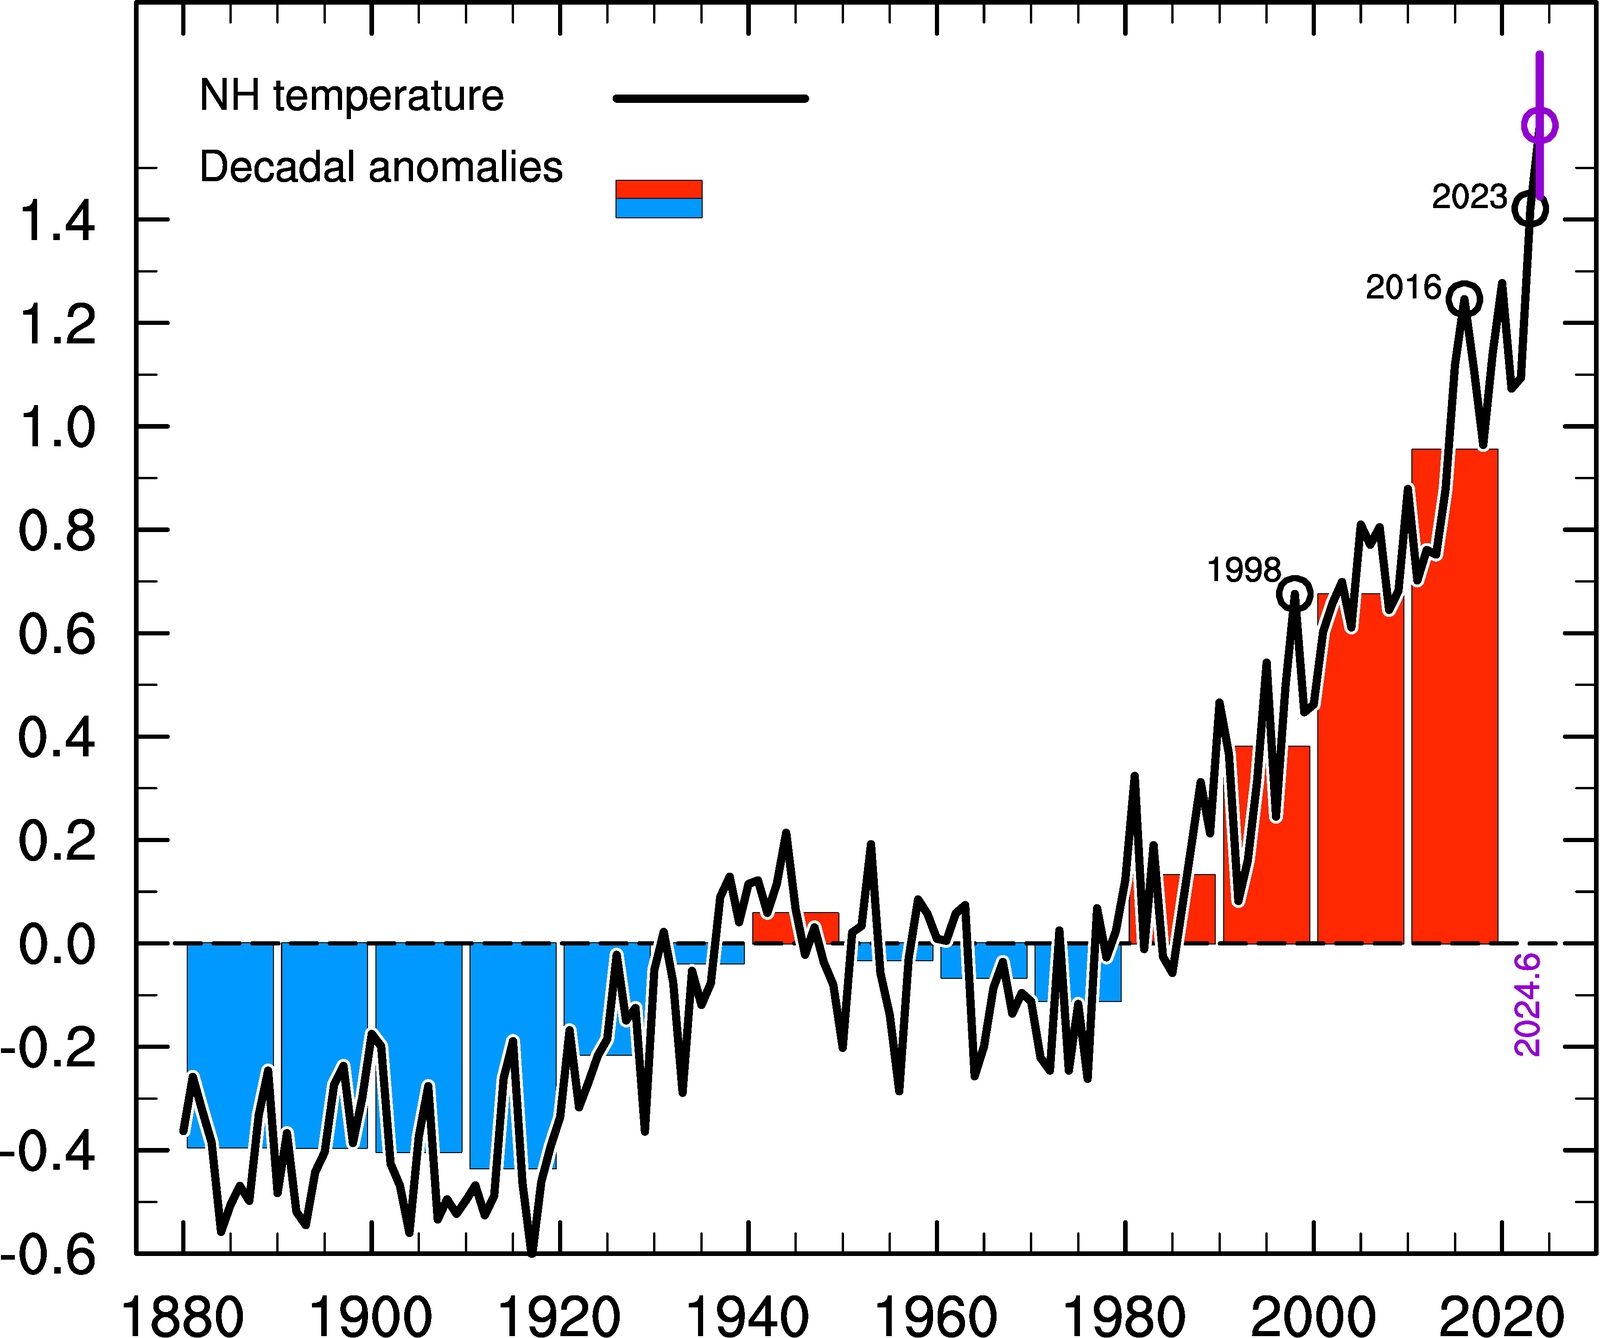
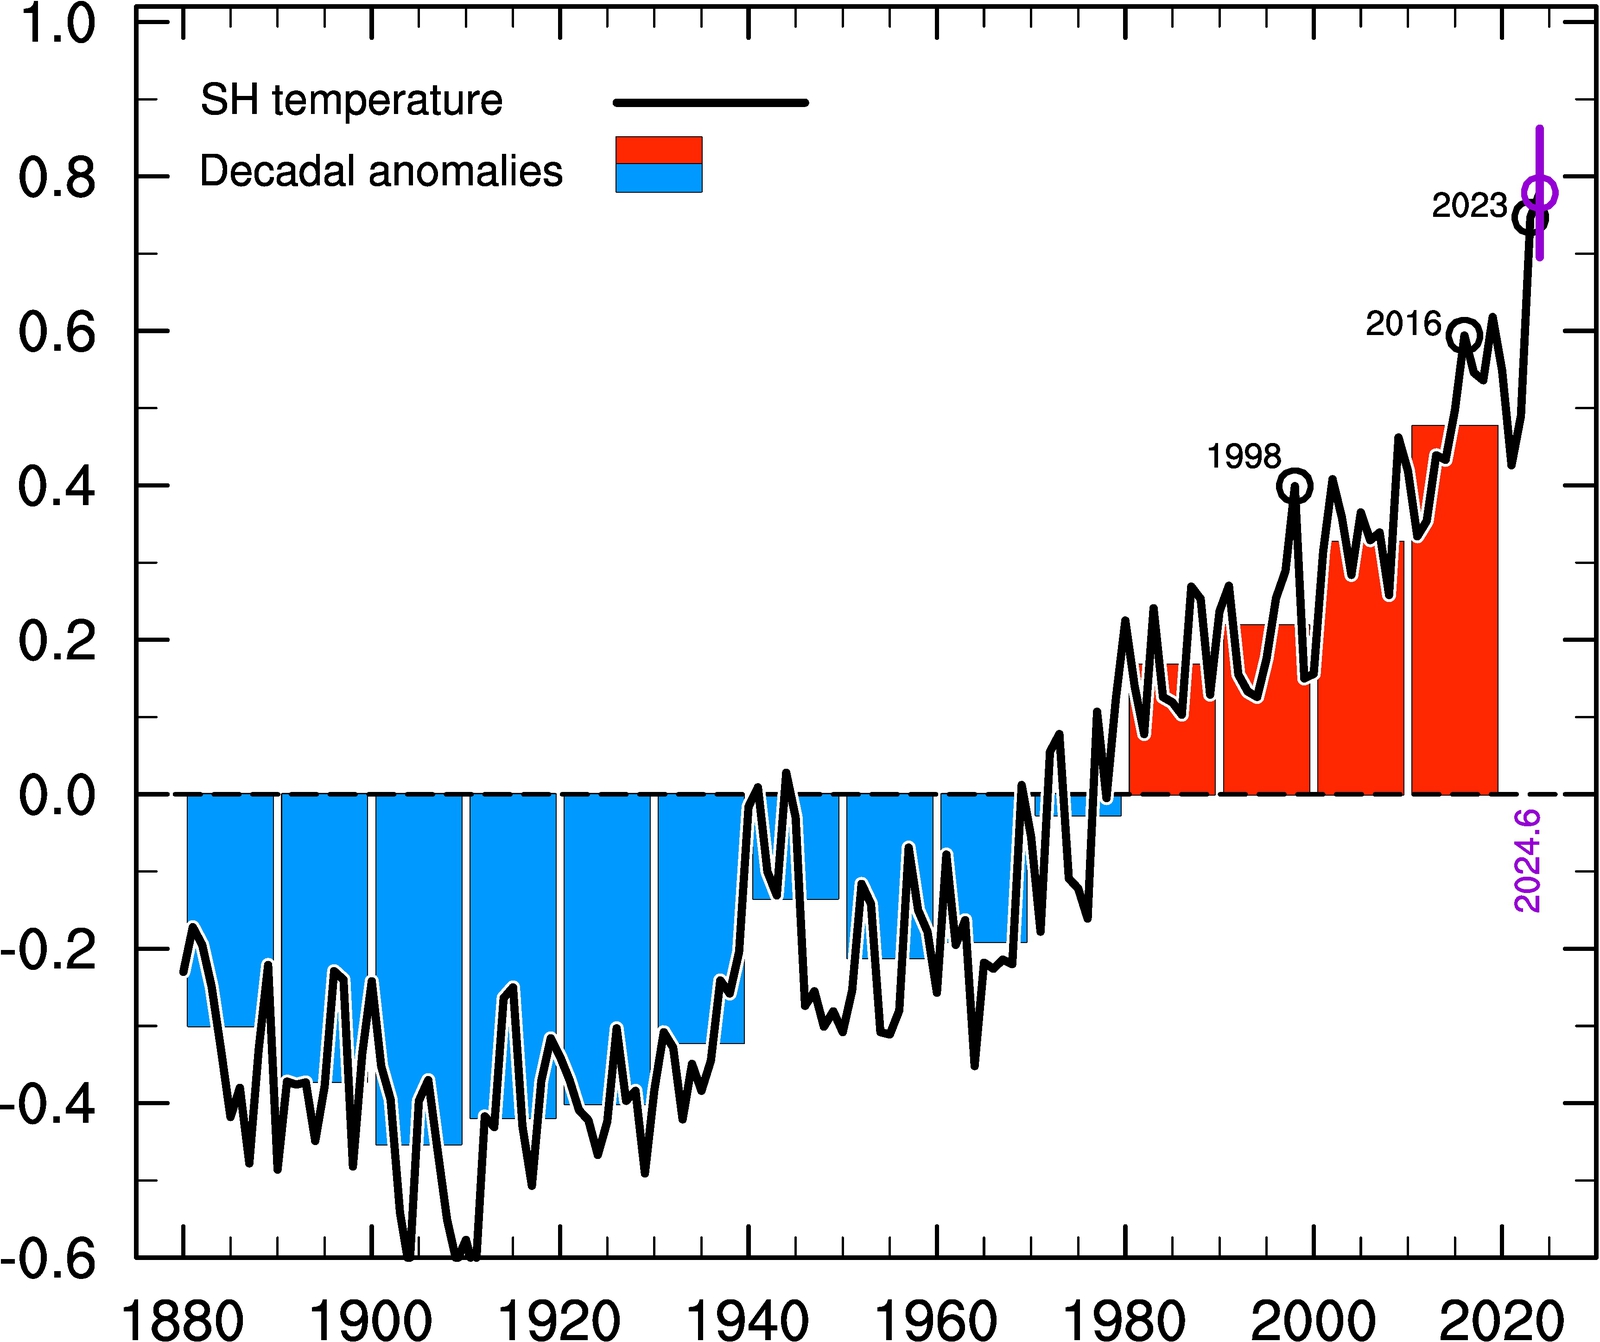
Annual mean global and hemispheric temperature time series until the last full year relative to the 1961-1990 mean temperature. Analysis of surface thermometer recordings in black (mean of GISS and HadCRUT5) and the corresponding decadal mean values as bars.
 
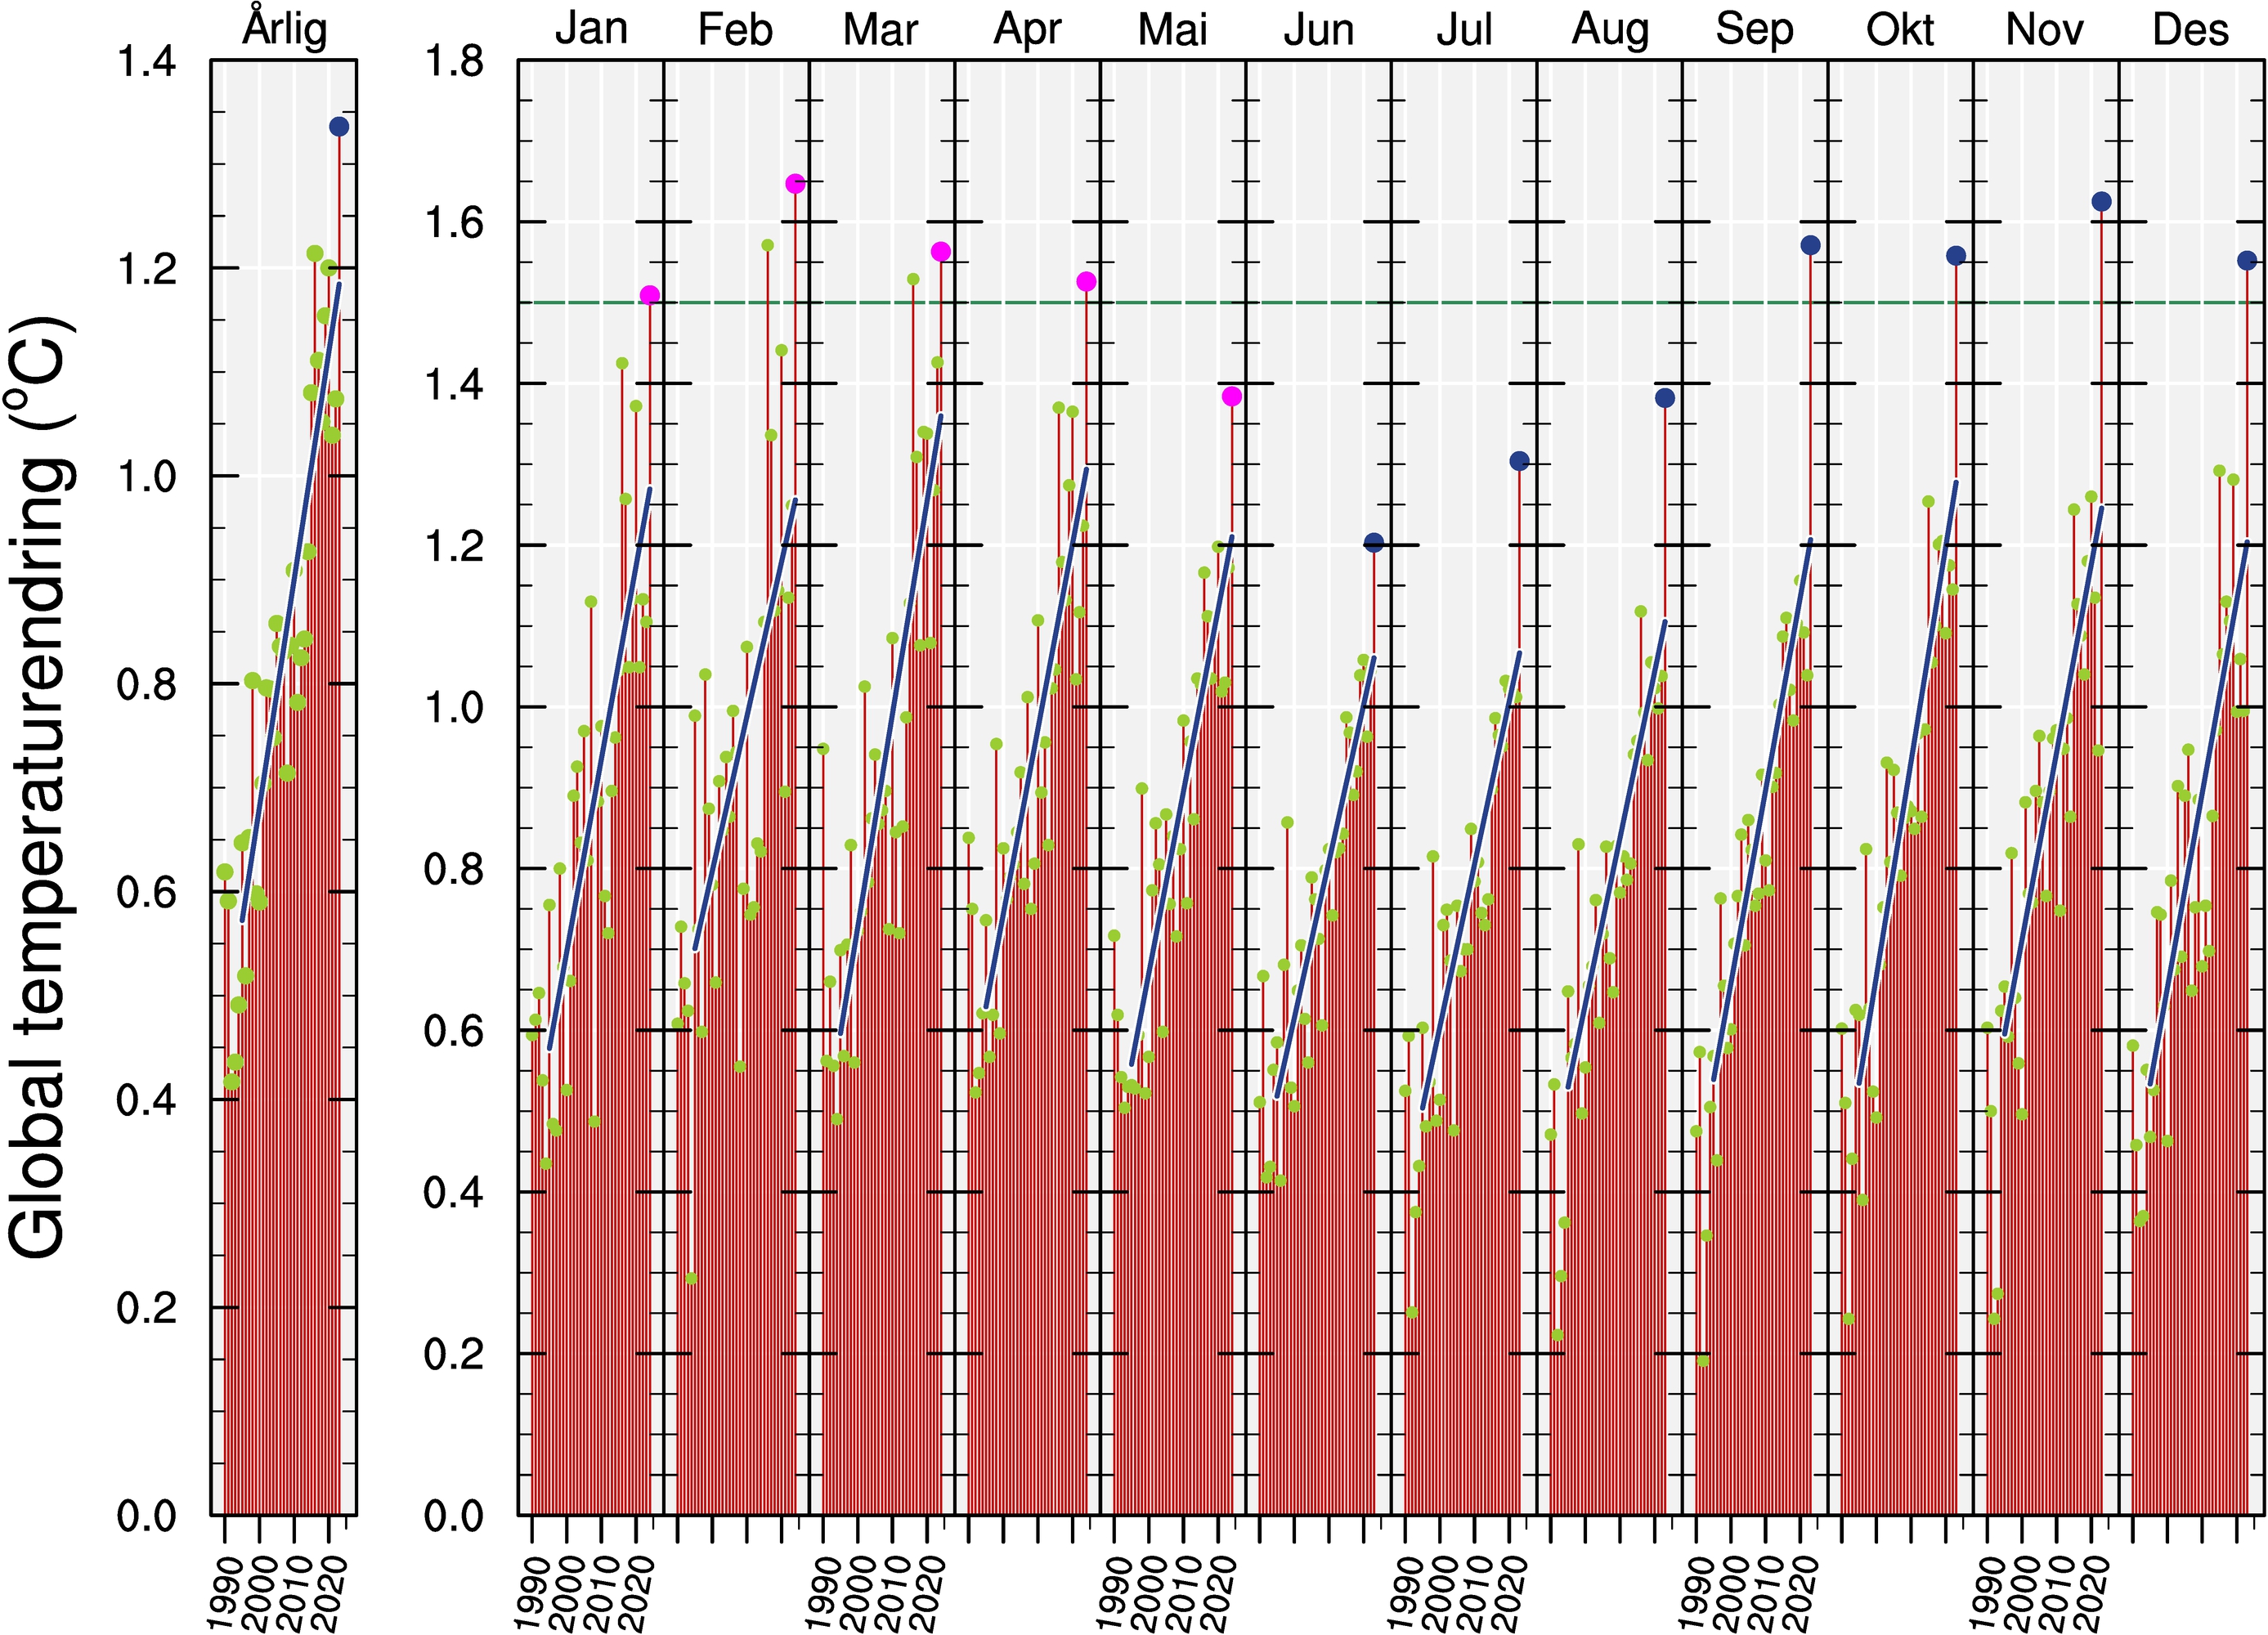
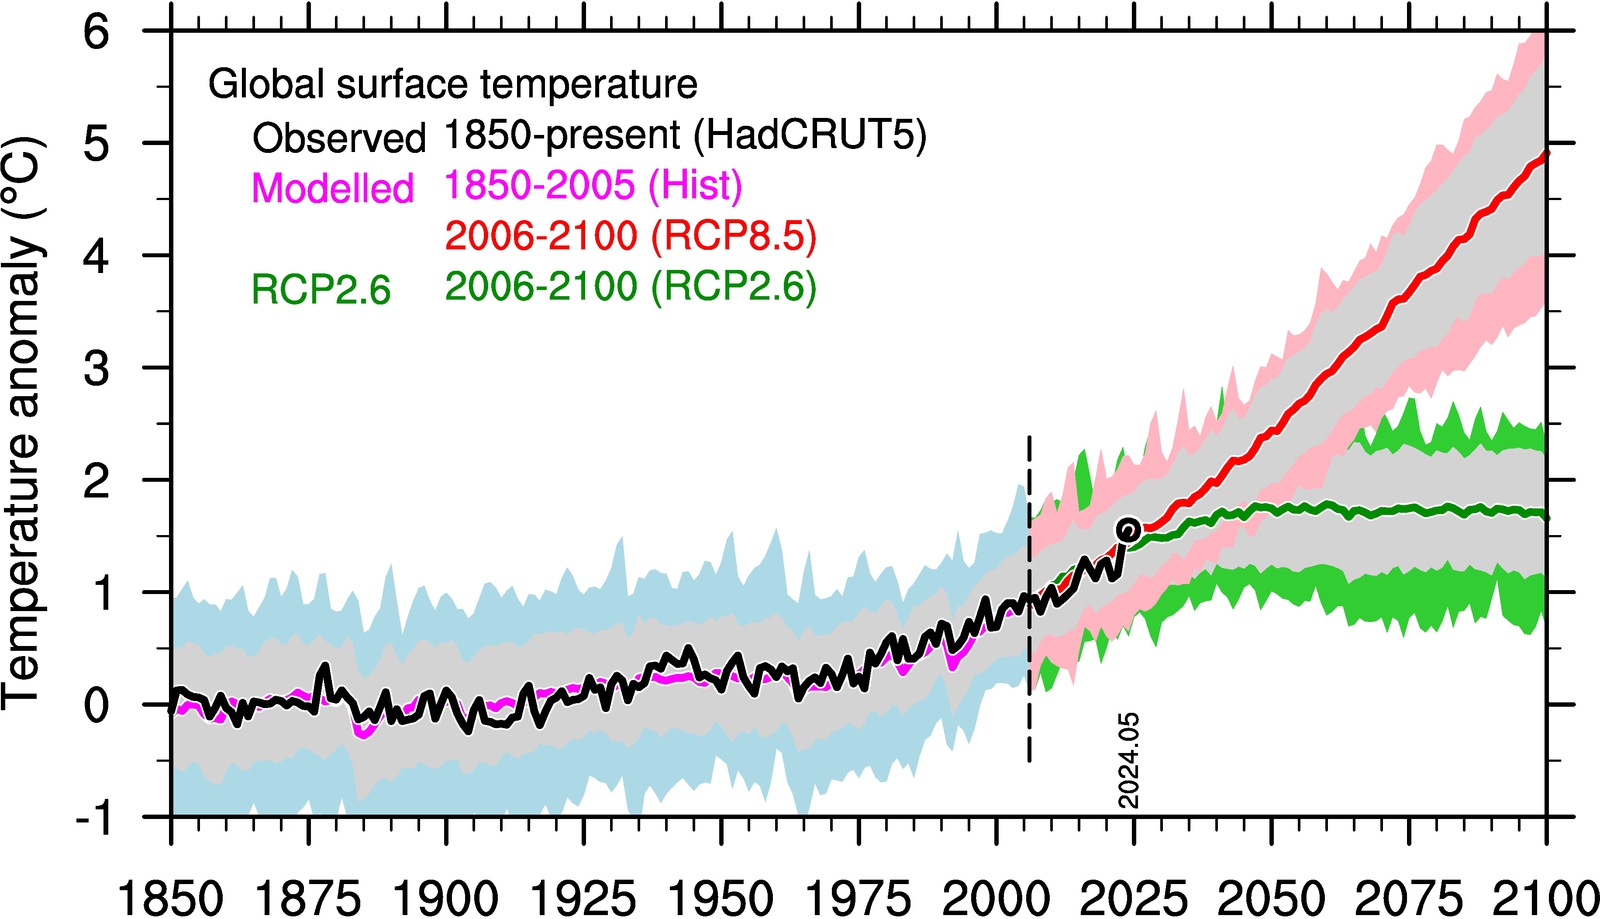
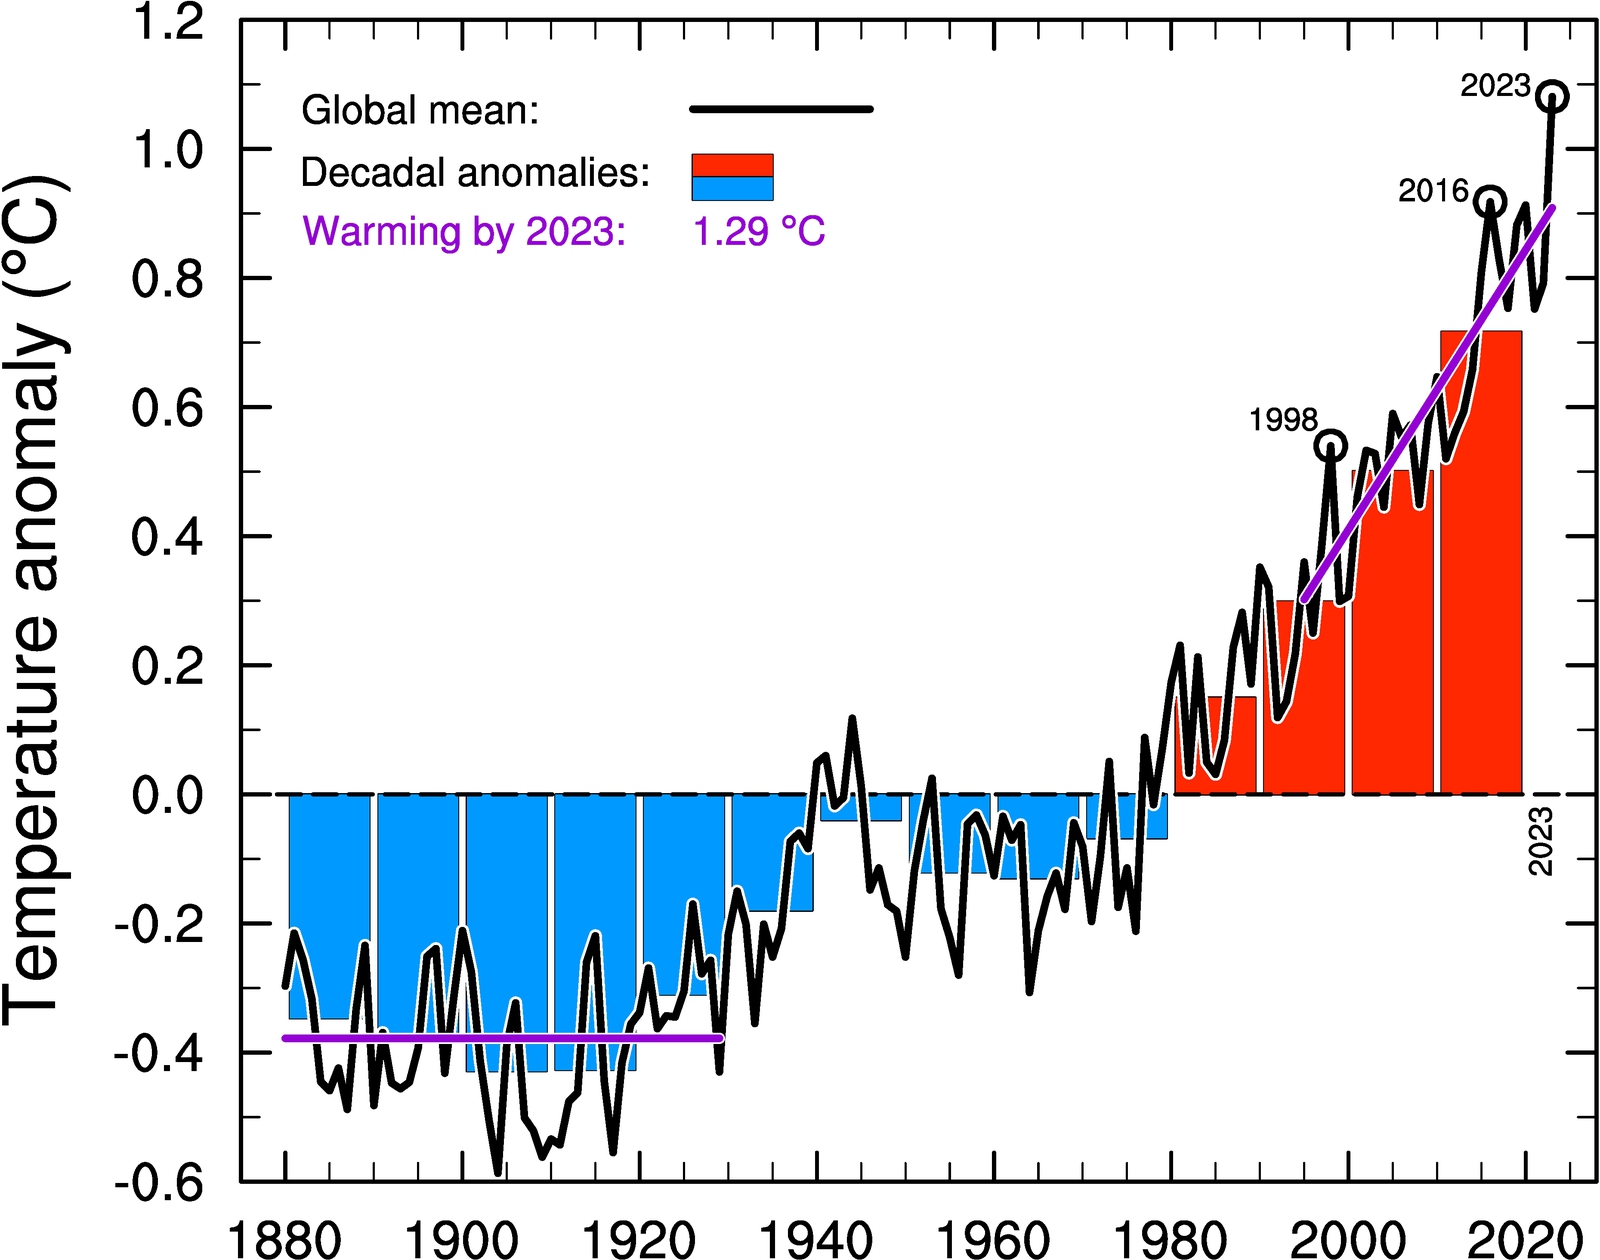
As above, but estimating the warming from preindustrial time until the last full year with data (magenta line segments). Preindustrial temperature is estimated as the average temperature during the first 50 years of data (1880-1929), the latter as the end point of the linear trend for the last 30 years.  
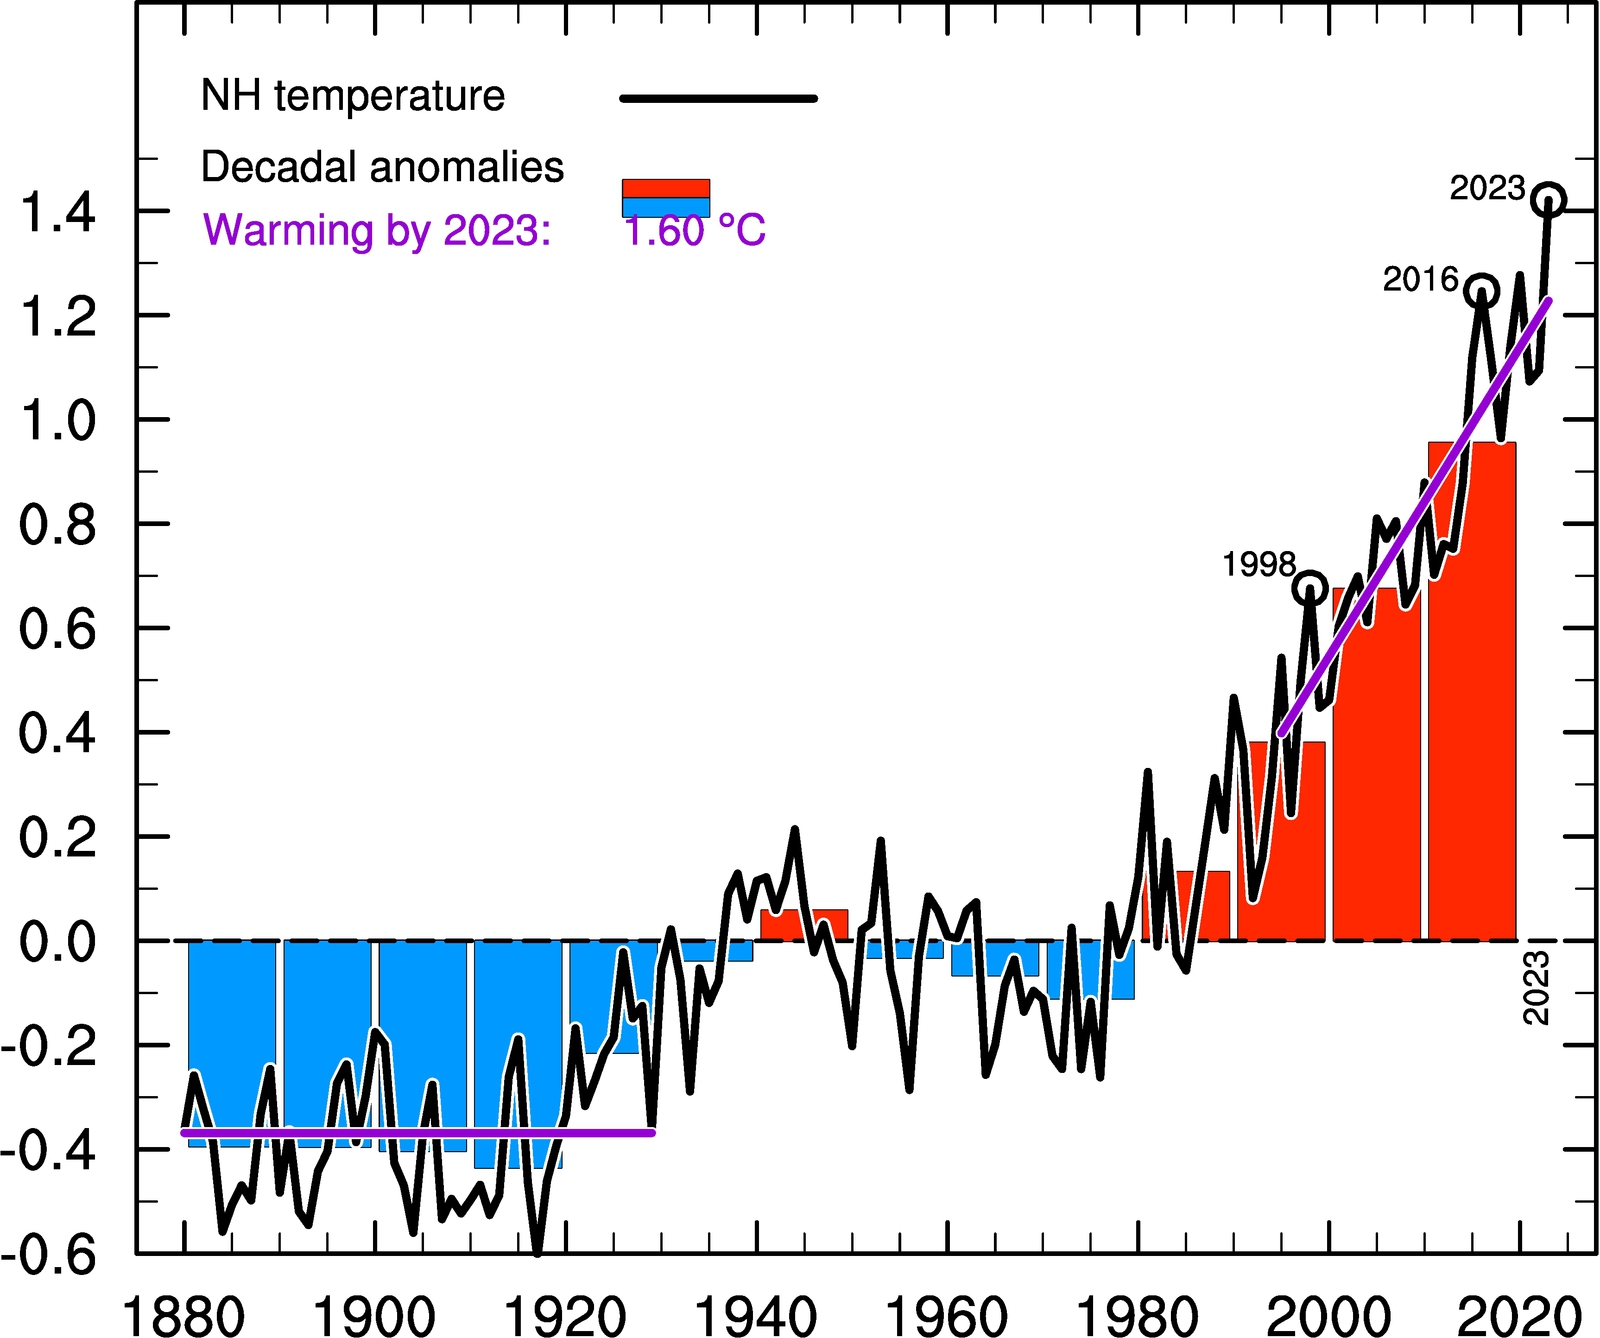
As above, but with identical range on the vertical axis (for visual comparison).  
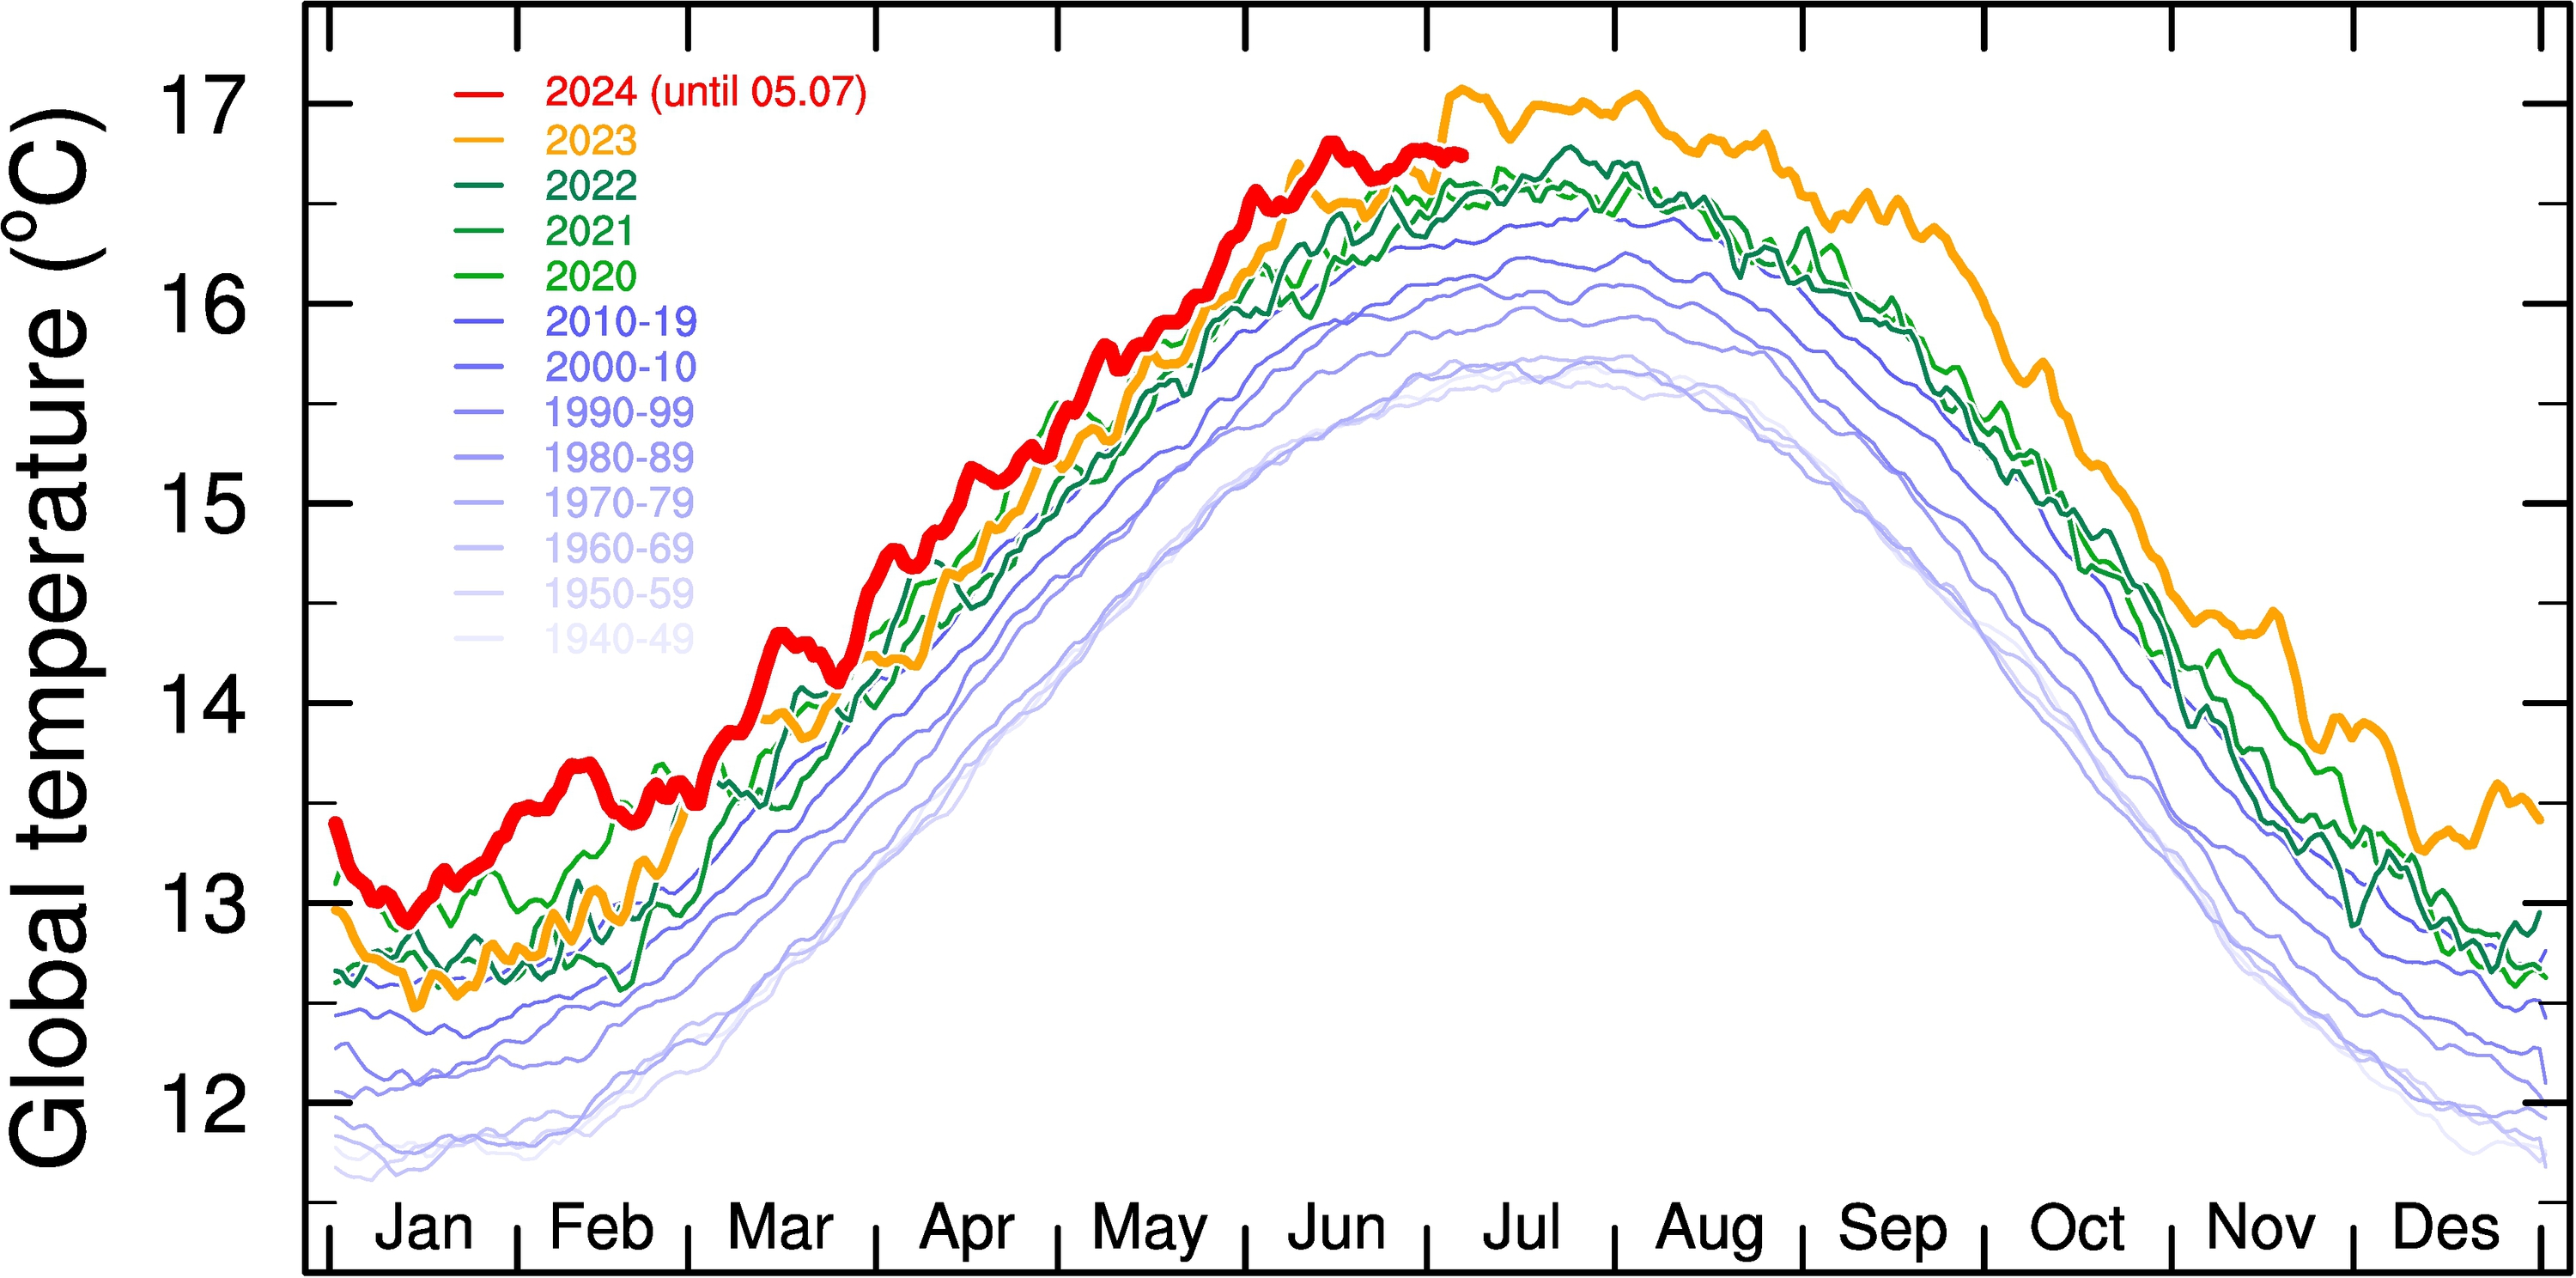
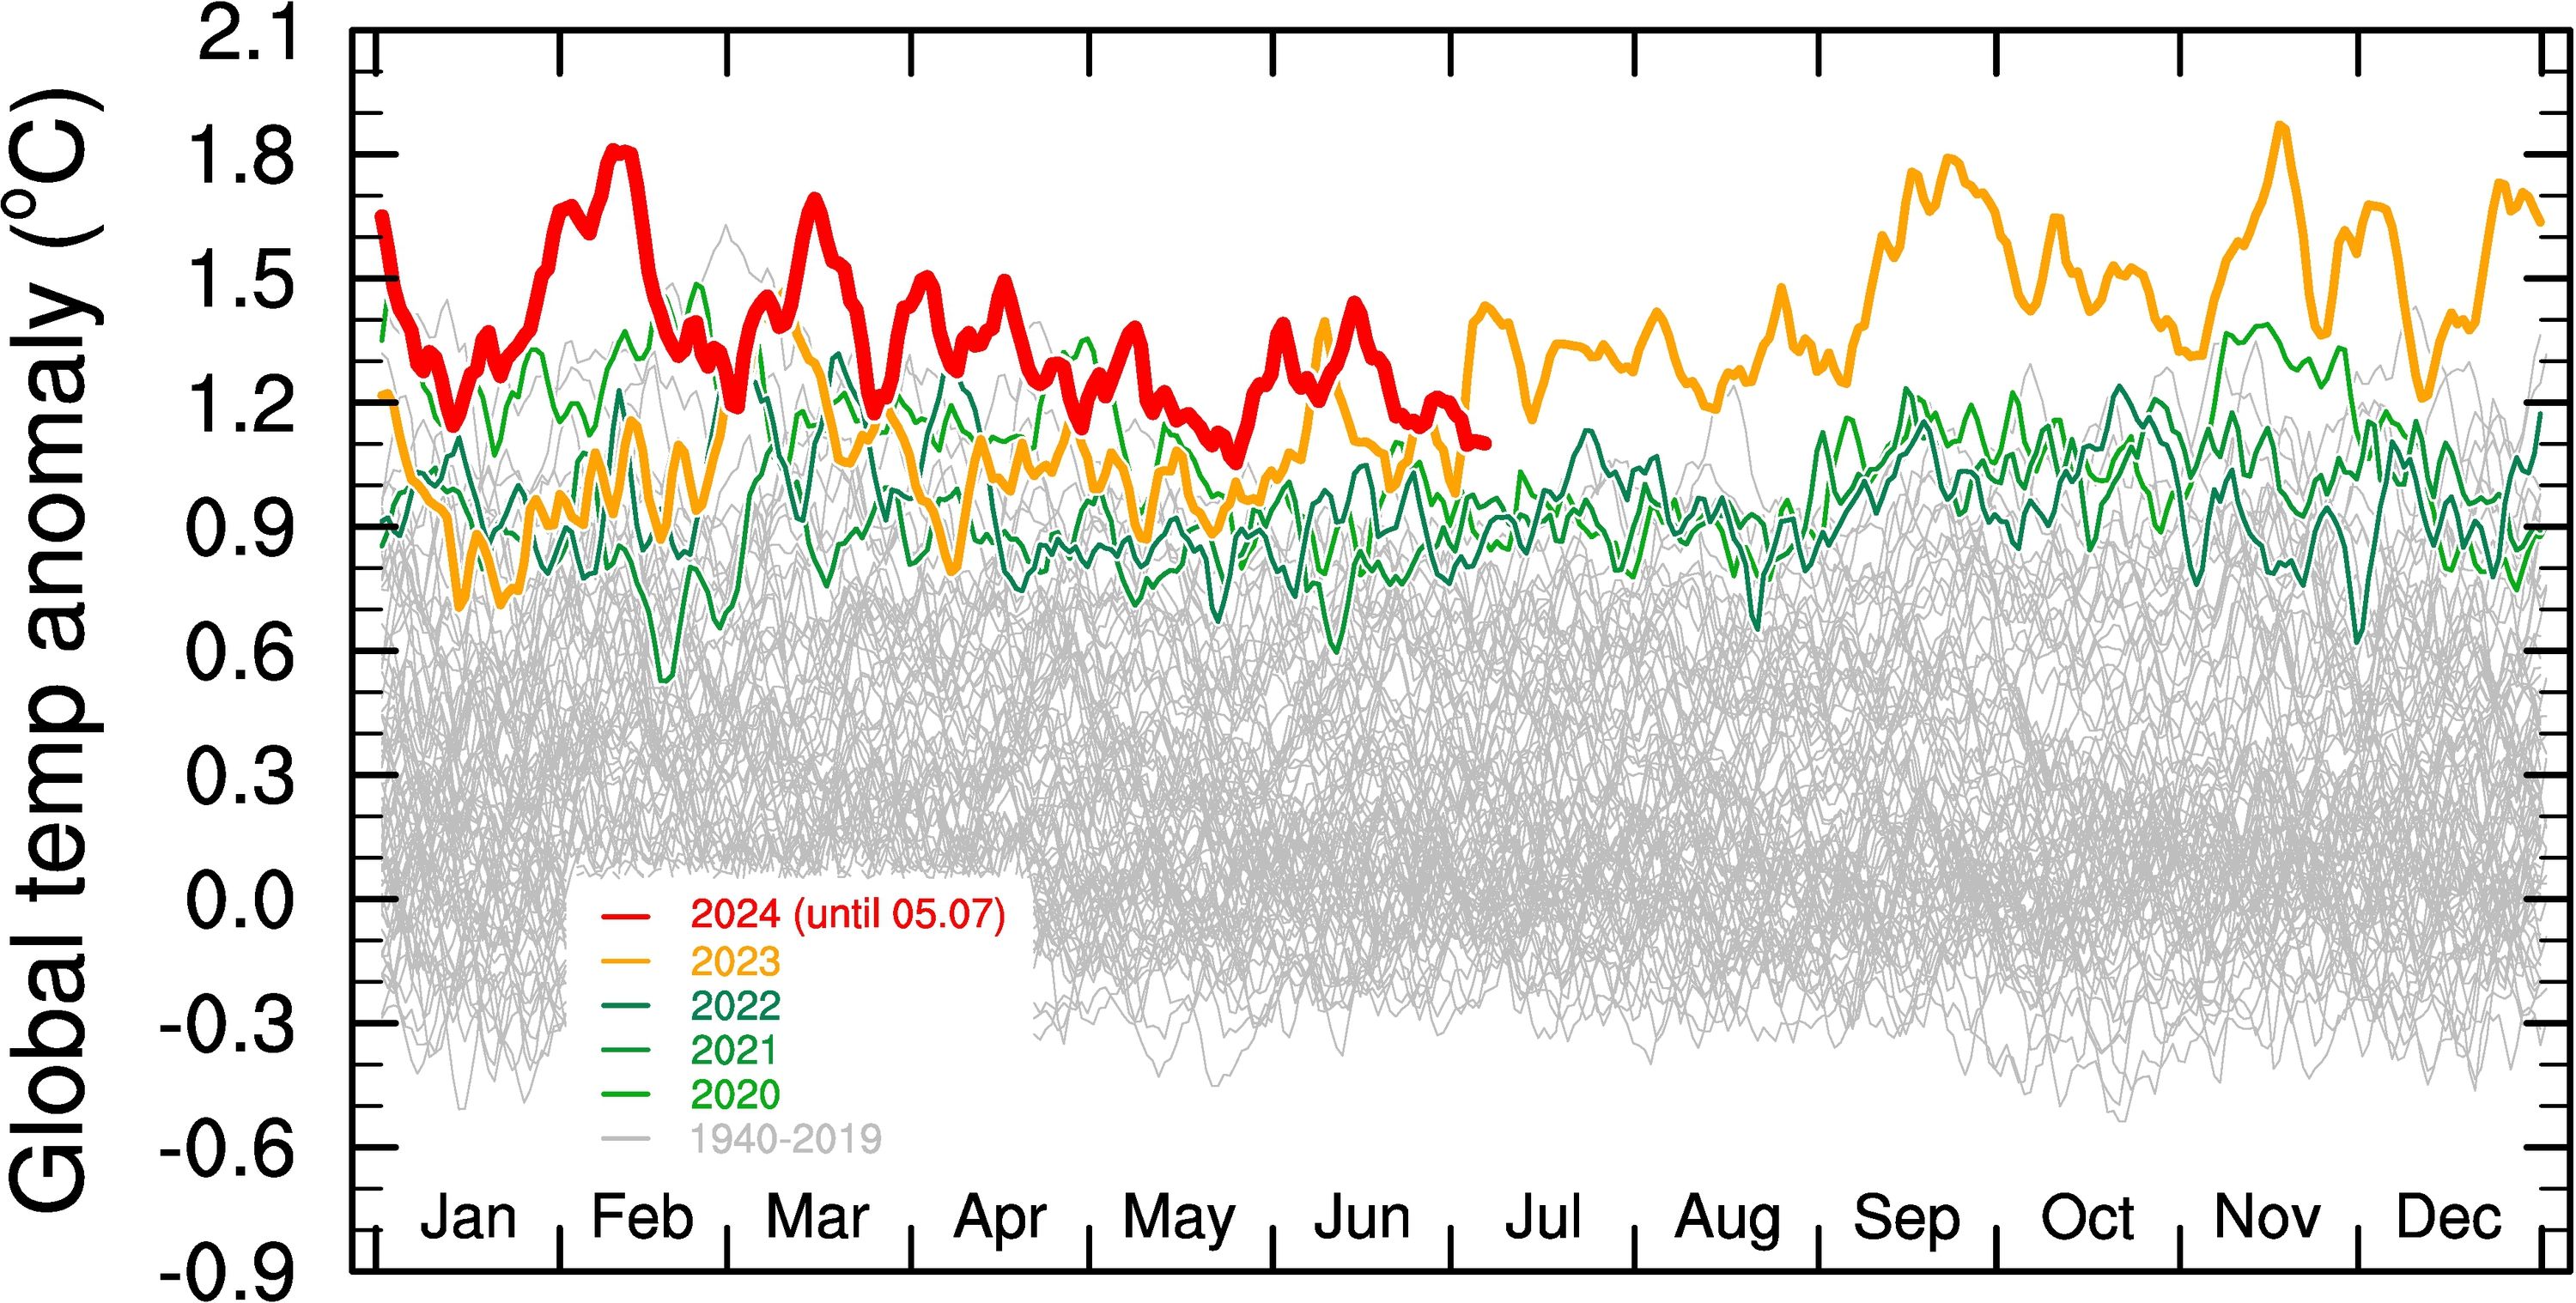
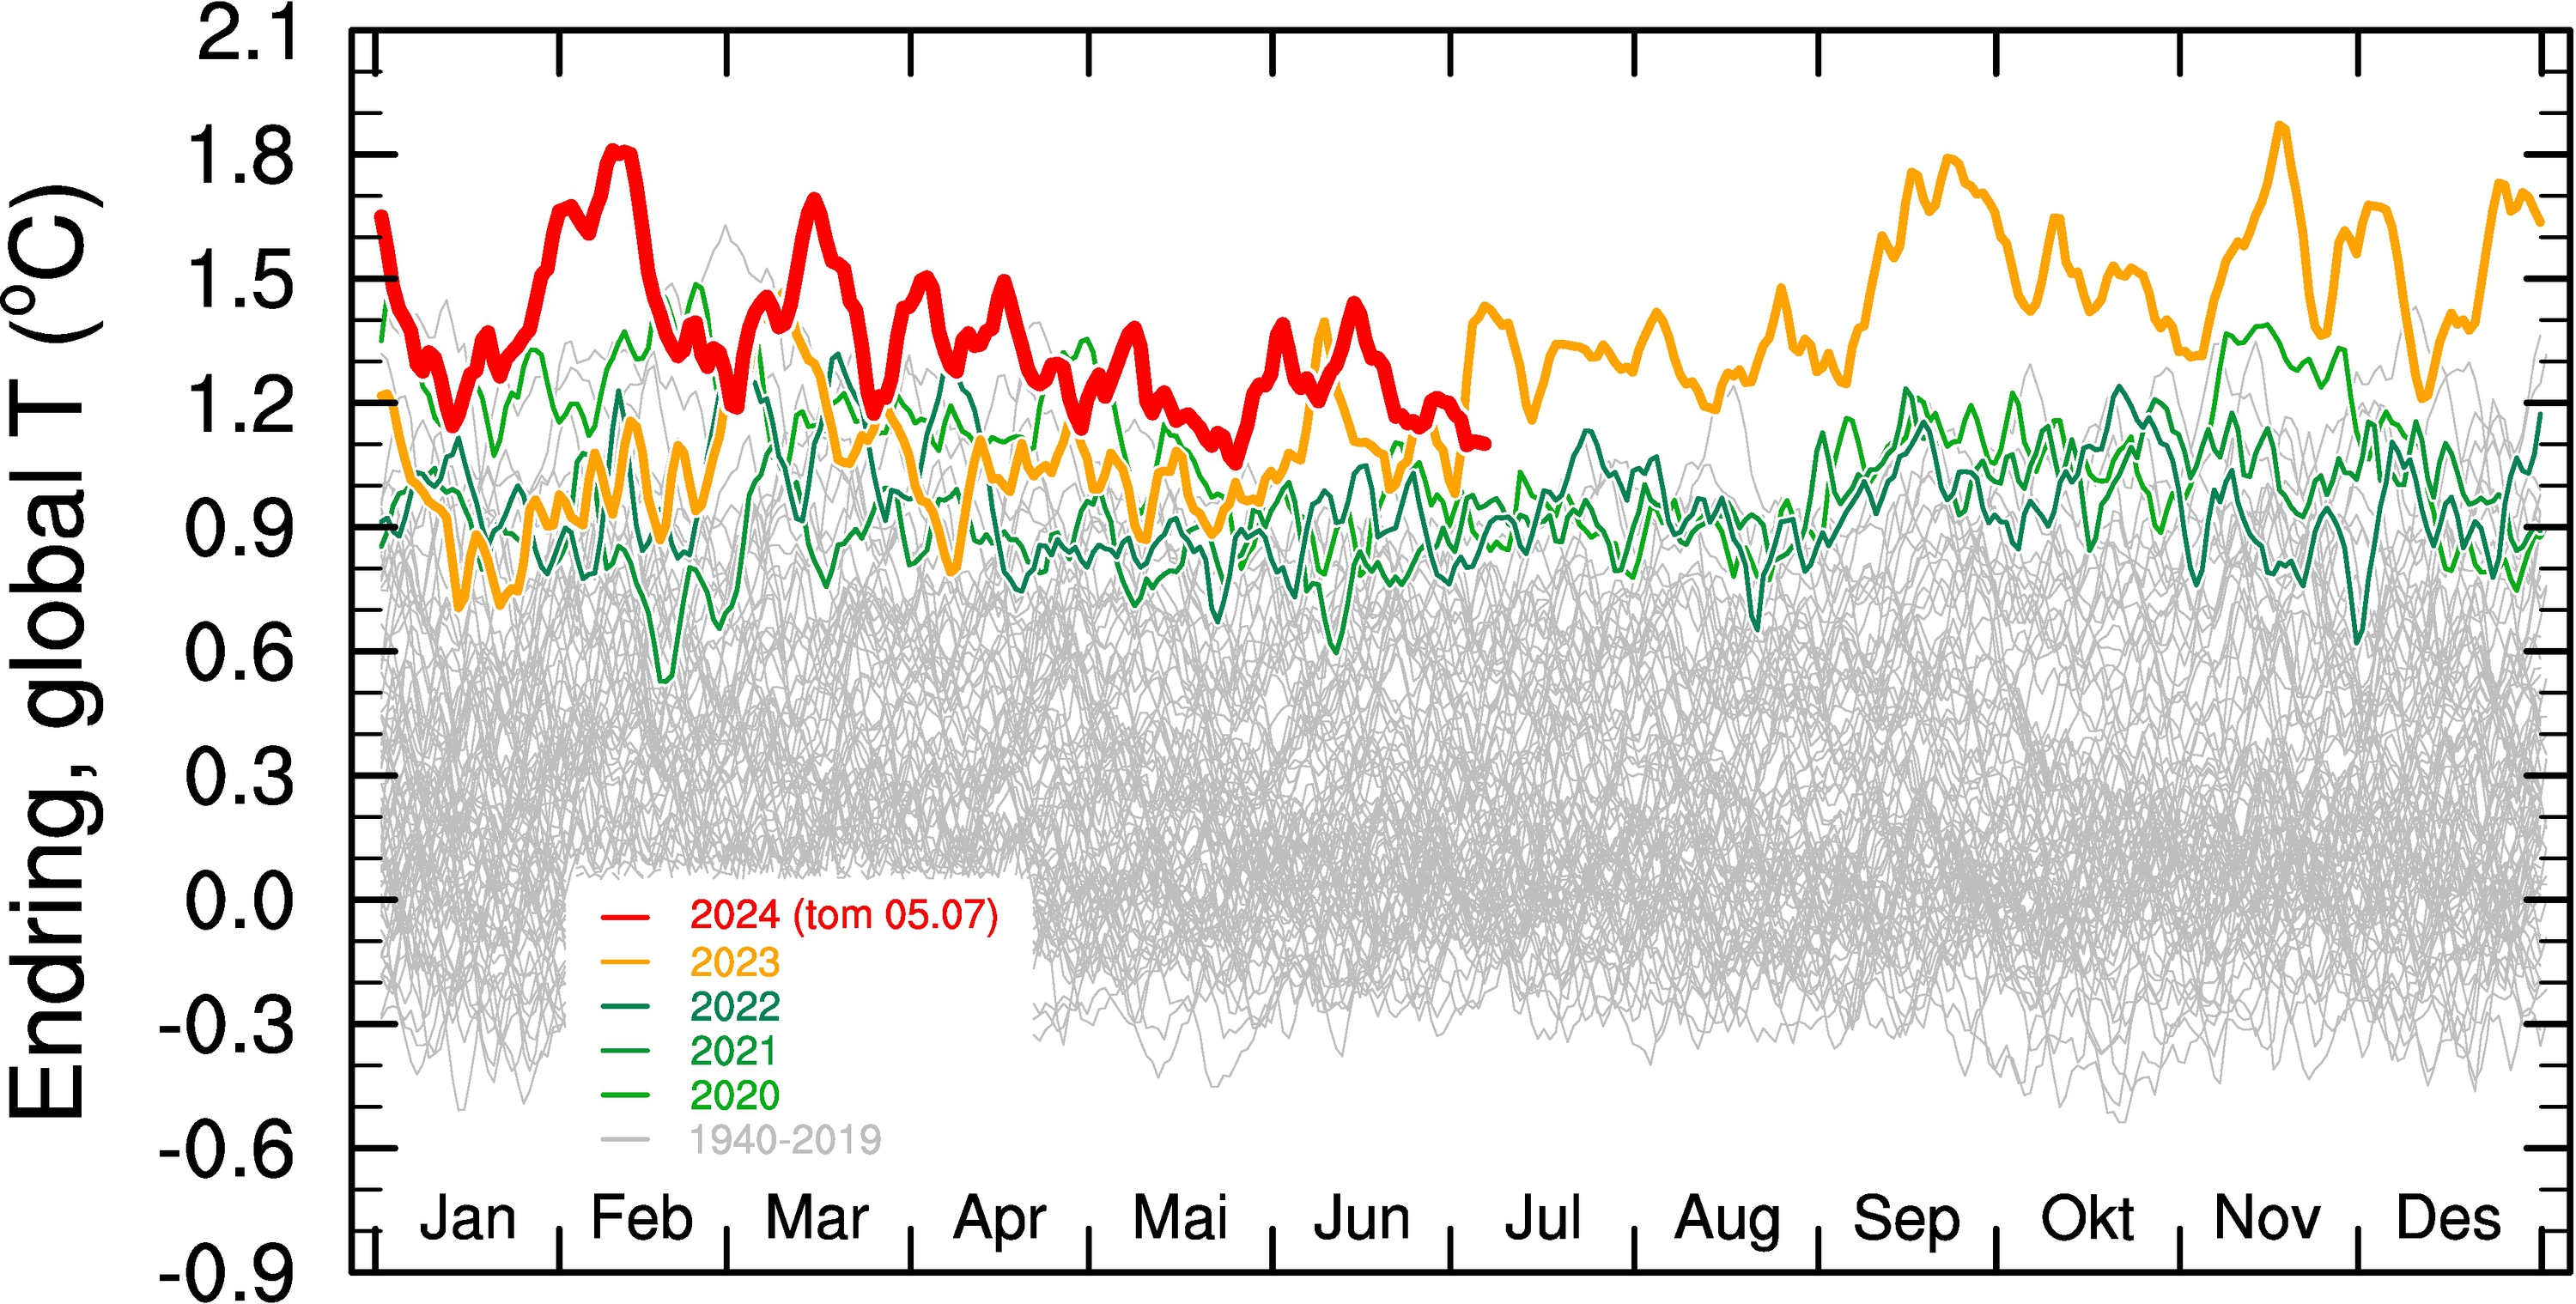
As above, but including the current year. The vertical line shows the +/- 1 standard deviation based on the temperature of the remaining months of the year, extracted from the latest 20 years.
 
Data. Animation of the GISS data. Animation, duration 30 sec.
Note: Errors may occur since all figures are automatically updated with only sporadic checking.
Return to Temperature overview. Return to top of page.

Observed change in monthly mean temperature since 1850

Global decadal mean (left) and global decadal monthly mean temperature relative to the 1961-1990 mean (since 1850). The last column (in pink) represents the latest, uncomplete decade, i.e., the mean of year 2020 to present.


Global annual mean (left) and global monthly mean temperature relative to the 1850-1900 mean, shown after 1990 to highlight the latest decades (see figure above for the entire period 1850 to present. Linear trend lines over the last 30 years in deep blue; 1.5 degree C warming indicated with the stippled green line. Magenta dots are for the current year; deep blue dots from the previous year.
Temperature analysis from NOAA. Note: Errors may occur since all figures are automatically updated with only sporadic checking.
Return to Temperature overview. Return to top of page.

Absolute global temperature since 1940

Absolute global temperature since 1940 from the ECMWF ERA5 reanalysis. Blue curves show decadal mean values; gray, green, orange and red curves are for individual years as indicated. Anomalies are relative to the 1940-1969 mean.


Temperature reanalysis from ECMWF ERA5. Note: Errors may occur since all figures are automatically updated with only sporadic checking.
Return to Temperature overview. Return to top of page.

Global sea surface temperature since 1985

Absolute and anomalous global (60 S to 60 N) sea surface temperature since 1985 based on observations by satellites, ships, buoys and floats. Grey curves show daily sea surface temperature for the period 1985-2019; green, orange and red curves are for individual years as indicated. For the anomaly plots, the zero value is the mean for the period 1985-2014.


Sea surface temperature from NOAA. Note: Errors may occur since all figures are automatically updated with only sporadic checking.
Return to Temperature overview. Return to top of page.

North Atlantic sea surface temperature since 1985

Absolute and anomalous Noth Atlantic (0-60 N) sea surface temperature since 1985 based on observations by satellites, ships, buoys and floats. Grey curves show daily sea surface temperature for the period 1985-2019; green, orange and red curves are for individual years as indicated. For the anomaly plots, the zero value is the mean for the period 1985-2014.


Sea surface temperature from NOAA. Note: Errors may occur since all figures are automatically updated with only sporadic checking.
Return to Temperature overview. Return to top of page.

Observed and modelled annual mean temperature since 1850

Comparison between observed (black line) and simulated (coloured lines and shadings) annual mean global surface (land + ocean) temperature relative to 1850-1899. The observed temperature time series is extended to the latest month with data (black circle). Gray shading shows the +/-2 standard deviation of the model spread, the coloured shadings show the full model spread, and the dashed, vertical line in 2006 shows the transition from historical (year 1850-2005) to scenario (2006-2100) runs. RCP8.5 is a "business-as-usual" scenario whereas RCP2.6 is constructed to be in line with the two degrees temperature target.

As above, but including the warming since 1850-1899 estimated from the end-point of the linear temperature trend for the last (complete) 30 years with data.
 
Observed temperature from the Hadley Centre. Modelled temperature from the CMIP5 Project. The above figures are updated versions of Fig. 1b in Medhaug and Drange (2016), Climate Dynamics, DOI: 10.1007/s00382-015-2811-y [file].